
www.taiwan-database.net
Tools 🛠
This page contains general background information about Taiwan—geography, climate, various statistics and many more topics—as listed in the directory below.
- Geography and climate briefs
- Data concerning area, dimensions, margins etc.
- Topography of Taiwan proper
- Rivers and lakes
- Smaller islands in the Taiwan area
- Geology: Faults, earthquakes, volcanism and more
- Climate
- Selected statistics Taiwan/ROC
- Preliminary notes
- Population statistics
- Public health statistics
- Economics and trade statistics
- Financial statistics
- Energy statistics
- The ROC postal codes (with numerical index)
- The ROC calendar
- The sound of Mandarin Chinese
- Selected traditional weights, measures, and numerals
- Japan's Taiwan
- The dynasties of imperial China: an overview
|
|
Note: Due to limited space on this page, most geographical names and other terms are shown here in English and Chinese characters only without Hanyu Pinyin.
===== ===== ===== ===== =====
◆ Geography and climate briefs (Taiwan)
- Data concerning area, dimensions, margins etc.
- Topography of Taiwan proper
- Rivers and lakes
- Smaller islands in the Taiwan area
- Geology: Faults, earthquakes, volcanism and more
- Climate
++++++++++ TOP HOME [next chapter] ++++++++++
Data concerning area, dimensions, margins etc.
- Dimensions of Taiwan proper
- Margins of Taiwan proper at shoreline
- Area and length of coastlines in the Taiwan area
- Shortest distance Taiwan proper—neighbours
- Shortest distance ROC—PRC
- Taiwan's position in the world
- Major time zones in Taiwan and the world
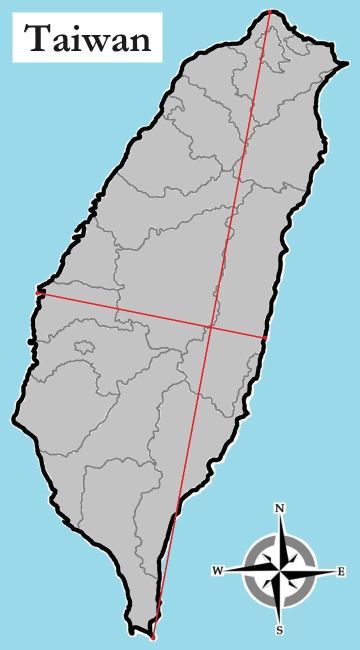
Dimensions of Taiwan proper
| Line | Distance | Reference point A | Reference point B |
|---|---|---|---|
| North–South [①–②] |
383 km | Fukuichiao Lighthouse 富貴角燈塔 (Shimen District 石門區, New Taipei City) ① | Eluanbi 鵝鑾鼻 (Hengchun Town 恆春鎮, Pingtung County) ② |
| West–East [③–④] |
141 km | Mailiao Industrial Harbour 麥寮工業專用港 (Houan Village 後安村, Mailiao Township 麥寮鄉, Yunlin County) ③ | Shihtiping 石梯坪 (Gangkou Village 港口村, Fengbin Township 豐濱鄉, Hualien County) ④ |
Click here to display illustration.
Source: Google Earth
TOP HOME [◆ Geography/climate] [Area, dimensions, margins]
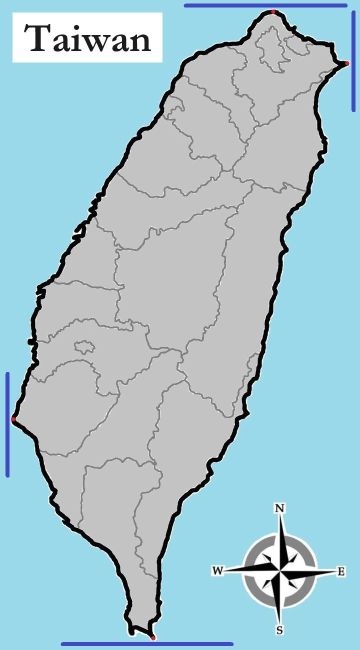
Margins of Taiwan proper at shoreline
| Margin | Location | Latitude | Longitude |
|---|---|---|---|
| Northernmost point | Fuji Borough 富基里 (Shimen District 石門區, New Taipei City) |
25° 17′ 56″ N | 121° 32′ 12″ E |
| Southernmost point | Eluan Borough 鵝鑾里 (Hengchun Town 恆春鎮, Pingtung County) |
21° 53′ 49″ N | 120° 51′ 34″ E |
| Westernmost point | Shifen Borough 十份里 (Qigu District 七股區, Tainan City) |
23° 06′ 04″ N | 120° 02′ 09″ E |
| Easternmost point | Fulian Borough 福連里 (Gongliao District 貢寮區, New Taipei City) |
25° 00′ 36″ N | 122° 00′ 22″ E |
Click here to display illustration.
Source: Google Earth
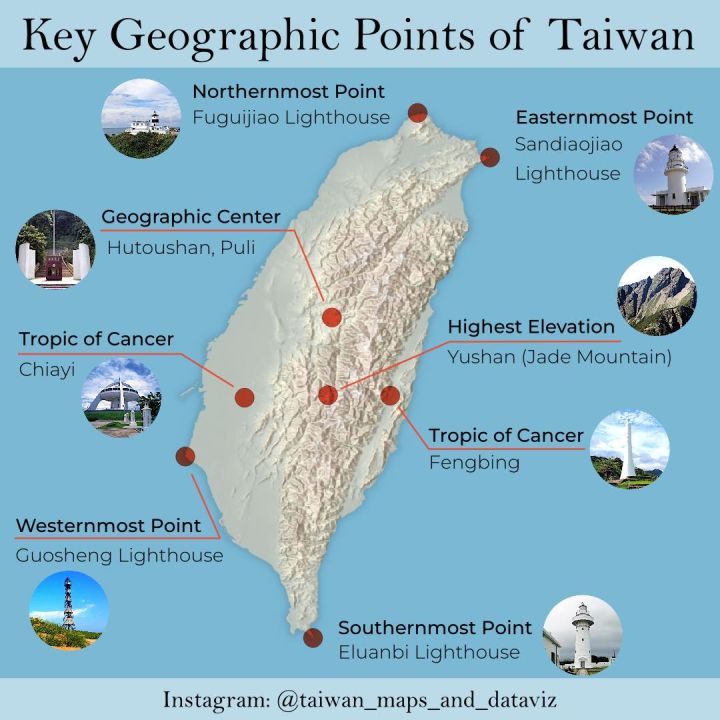
For an instructive map showing key geographic points of Taiwan, created by Taiwan-based German digital creator and blogger Alex Kunz, please click here.
TOP HOME [◆ Geography/climate] [Area, dimensions, margins]
Area and length of coastlines in the Taiwan area
(Tidal flat excluded)
| Taiwan proper | Penghu | Offshore islands | Taiwan area total | |
|---|---|---|---|---|
| Area | 35,767.6263 km² | 126.8641 km² | 74.8023 km² | 35,969.2927 km² |
| Length coastline | 1,139.2483 km | 326.7635 km | 100.3273 km | 1,566.3391 km |
Total number of islands in the Taiwan area: 86.
Source: Department of Land Administration 地政司, MOI
TOP HOME [◆ Geography/climate] [Area, dimensions, margins]
Shortest distance Taiwan proper—neighbours
| Distance | Reference point in Taiwan (ROC) | Reference point in neighbouring country |
|---|---|---|
| 136.34 km | Zhonghe Borough 中和里 (Houlong Town 後龍鎮, Miaoli County) | PRC—Wan'an Village 萬安村 (Dongshan Town 東瀚鎮, Fuqing City 福清市, Fuzhou City 福州市, Fujian Province) |
| 107.50 km | Beifang'ao Bi 北方澳鼻 (Suao Town 蘇澳鎮, Yilan County) | Japan—Yonaguni Island 与那国島 |
| 141.26 km | Southern tip (Pingtung County) | Philippines—Mavulis Island |
| 104.26 km | Lanyu 蘭嶼 (Taitung County) | " |
| 978.66 km | Northern tip (New Taipei City) | South Korea—Marado Island 馬羅島 |
Source: Google Earth
Please note that Taiwan is geographically moving slowly towards the China mainland, and the two sides are expected
to be united in about 1.5 million years.
TOP HOME [◆ Geography/climate] [Area, dimensions, margins]
Shortest distance ROC—PRC
| Distance | Reference point in the ROC | Reference point in the PRC |
|---|---|---|
| 4.27 km | Ta-tan Island 大膽島 (Kinmen County) | Baishi Cannon Fort 白石炮台遺址 (Binhai Street Office 濱海街道, Siming District 思明區, Xiamen City 廈門市, Fujian Province) |
Source: Google Earth
TOP HOME [◆ Geography/climate] [Area, dimensions, margins]
Taiwan's position in the world
The ROC Presidential Office in Taipei City can be regarded as the political center of Taiwan. According to Google Earth, its coordinates are latitude 25° 02' 23" N (or 25.0408 N), longitude 121° 30' 44" E (or 121.5097 E). Major cities in the world at approximately the same northern latitude (± 1 degree) are Kunming 昆明 (Yunnan Province, PRC), Karachi (Pakistan), Riyadh, Medina (both Saudi Arabia), Luxor (Egypt), Ad Dakhla (Western Sahara), Nassau (Bahamas), Tavernier (Florida, USA), Monterrey (Mexico); major cities at the same eastern longitude between the North Pole and the South Pole are Dalian 大連 (Liaoning Province, PRC), Qingdao 青島 (Shandong Province, PRC), Broome, Esperance (both Australia).
A plane flying straight westward from the ROC Presidential Office on the same latitude would pass through Taiwan, the Taiwan Strait, the PRC, Myanmar, Bangladesh, India, Pakistan, the Gulf of Oman, the United Arab Emirates, the Persian Gulf, Qatar, Saudi Arabia, the Red Sea, Egypt, Libya, Algeria, Mauritania, Western Sahara; the Atlantic, the Bahamas, the US, the Gulf of Mexico, Mexico, the Pacific, and through Japan's Ryukyu island chain. A plane coming from the North Pole flying straight southward towards Taipei on the same longitude would pass through the Laptev Sea, Russia, the PRC, the Yellow Sea, the Taiwan Strait, Taiwan, the Bashi Channel, the Philippines, the Sulu Sea, the Celebes Sea, Indonesia, the Gulf of Tomini, the Savu Sea, Australia, the Indian Ocean, the Southern Ocean, and Antarctica.
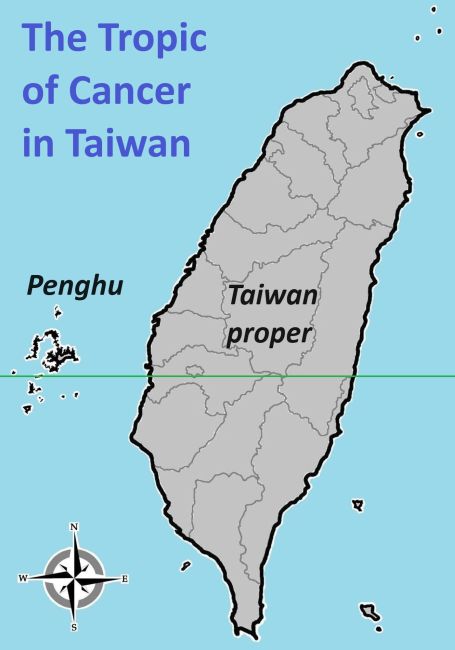
The Tropic of Cancer 北回歸線 (latitude 23° 26' 13.8" N) crosses Taiwan in the waters of Penghu County, in Chiayi County, Chiayi City, Kaohsiung City, Nantou County, and Hualien County.
The following four links show maps indicating Taiwan's position in the world; copyright: © Relief Maps, computed by Hans Braxmeier; courtesy maps-for-free.com.
| Taiwan in the world | Taiwan in Asia | Taiwan in East Asia | Taiwan off continental China |
Click here to see five maps from the same source as high-resolution image sequence in MP4 format.
TOP HOME [◆ Geography/climate] [Area, dimensions, margins]
Major time zones in Taiwan and the world
The table below shows Taiwan's time zone in comparison with selected major time zones in the US and Europe plus Japan, including the following: Coordinated Universal Time (abbrev. UTC)/Greenwich Mean Time (GMT) as the world's primary time standard; in the US—Pacific Standard Time (PST), Mountain Standard Time (MST), Central Standard Time (CST), Eastern Standard Time (EST); in Europe—Central European Time (CET).
| PST (UTC –8) |
MST (UTC –7) |
CST (UTC –6) |
EST (UTC –5) |
UTC — |
CET (UTC +1) |
Taiwan (UTC +8) |
Japan (UTC +9) |
|---|---|---|---|---|---|---|---|
Please note that the same time applies year-round in Taiwan as there is no Daylight Saving Time (DST). Major zones with DST in the US and Europe are calculated as follows: PDT (UTC –7), MDT (UTC –6), CDT (UTC –5), EDT (UTC –4); Central European Summer Time (CEST) = UTC +2.
TOP HOME [◆ Geography/climate] [Area, dimensions, margins]
Topography of Taiwan proper
Taiwan's main topographical features are the central mountain range and the coastal plains in the west. More than 200 peaks in Taiwan are rising higher than 3,000 m above sea level; they are referred to in Chinese as baiyue 百岳.
- Mountains (64 %)—Central Range 中央山脈, Mount Snow Range 雪山山脈, Mount Jade Range 玉山山脈, Mount Ali Range 阿里山山脈, East Coastal Range 東部海岸山脈
- Plains and basins (19.8 %)—Lanyang Plain 蘭陽平原, Chianan Plain 嘉南平原, Pingtung Plain 屏東平原; Taipei Basin 台北盆地, Taichung Basin 台中盆地, the 158-km-long East Longitudinal Valley 台東縱谷
- Floodland (3.1 %)
 |
 |
|||
| ⇦ Northern Taiwan | ||||
| Southern Taiwan ⇨ | ||||
Copyright notice for the two maps above: © Relief Maps, computed by Hans Braxmeier (courtesy maps-for-free.com). For a physical map that shows the topographical features of Taiwan proper as a whole please click here.
Ten highest mountains on Taiwan
| Mountain's name | Elevation | Main summit's location (city / county) |
|---|---|---|
| Mount Jade 玉山 (Yushan) | 3,952 m | Kaohsiung/Nantou/Chiayi County |
| Snow Mountain 雪山 (Xueshan) | 3,886 m | Taichung |
| Xiuguluan Mountain 秀姑巒山 aka Mahuolasih Mountain 馬霍拉斯山 |
3,800 m | Nantou |
| Mabolasi Mountain 馬博拉斯山 aka Wulameng Mountain 烏拉孟山 |
3,765 m | Nantou |
| Nanhu Mountain 南湖大山 | 3,742 m | Taichung |
| Kailantekun Mountain 凱蘭特崑山 | 3,730 m | Taichung |
| Dongxiaonan Mountain 東小南山 | 3,711 m | Kaohsiung |
| Central Range Point 中央尖山 | 3,705 m | Taichung |
| Mount Guan 關山 (Guanshan) | 3,668 m | Kaohsiung |
| Matelan Mountain 馬特蘭山 aka Ganmulin Mountain 甘木林山 |
3,660 m | Taichung |
Mount Jade, located in the juncture area of Kaohsiung City, Nantou County and Chiayi County, is not only the tallest mountain in the Taiwan area but the highest peak in East Asia. It is also called "Mt. Morrison" in English and "Tongku Saveg" 東谷沙飛 by the Bunun indigenous people living in that area.
TOP HOME [◆ Geography/climate] [Taiwan's topography]
Rivers and lakes
Taiwan's river system is marked by short rivers (none exceeding 200 km in overall length), and there are few natural lakes. Freshwater supply is provided by man-made reservoirs. (A list of major reservoirs can be found further below.)
Taiwan's ten longest rivers
| River's name | Length | Area from source(s) to mouth (city / county) |
|---|---|---|
| Chuoshui River 濁水溪 | 186.6 km | Nantou, Yunlin, Changhua |
| Kaoping River 高屏溪 | 171.0 km | Pingtung, Kaohsiung |
| Tamsui River 淡水河 | 158.7 km | Taipei, New Taipei City |
| Tsengwen River 曾文溪 | 138.47 km | Chiayi County, Tainan |
| Dahan Creek 大漢溪 | 135 km | New Taipei City, Taoyuan, Hsinchu County |
| Laonong River 荖濃溪 | 133 km | Kaohsiung |
| Dajia River 大甲溪 | 124.2 km | Taichung |
| Dadu River 大肚溪 aka Wu River 烏溪 |
119.13 km | Taichung, Changhua, Nantou |
| Xiuguluan River 秀姑巒溪 | 104 km | Hualien |
| Daan River 大安溪 | 95.76 km | Miaoli |
For a rough sketch of Taiwan's river system click here. (The approximate line of the east-west watershed is marked in red.)
TOP HOME [◆ Geography/climate] [Rivers + lakes]
Taiwan's ten largest natural lakes
| Lake's name | Size | Location |
|---|---|---|
| Sun Moon Lake 日月潭 aka Zitun | 840 ha | Yuchi Township, Nantou |
| Longluan Lake 龍鑾潭 | > 120 ha | Hengchun Town, Pingtung |
| Liyu Lake 鯉魚潭 | 104 ha | Shoufeng Township, Hualien |
| Chengcing Lake 澄清湖 | 103 ha | Wusong District, Kaohsiung |
| Zhongzheng Lake 中正湖 | 27 ha | Meinong District, Kaohsiung |
| Liyu Lake 埔里鯉魚潭 | 20 ha | Puli Town, Nantou |
| Cueifong Lake 翠峰湖 | ~ 20 ha | Datong Township, Yilan |
| Meihua Lake 梅花湖 | 18.2 ha | Dongshan Township, Yilan |
| Longtan Lake 龍潭湖 / 龍潭大池 | 18 ha | Longtan District, Taoyuan |
| Dalupalringi 大鬼湖 | 11.87 ha | Maolin District, Kaohsiung |
Please note that Sun Moon Lake, the largest body of water on Taiwan proper, is considered a semi-natural lake as several hydroelectric power plants were built there since 1919. A list of major reservoirs under the administration of the MOEA's Water Resources Agency (WRA) is shown directly below.
| Reservoir's name | Location | Completed in |
|---|---|---|
| Wushantou Reservoir (wushantou shuiku 烏山頭水庫) | Guantian and Liujia Districts (Tainan City) | May 1930 |
| Agongdian Reservoir (agongdian shuiku 阿公店水庫) | Yanchao District (Kaohsiung City) | August 1953 |
| Shimen Reservoir (shimen shuiku 石門水庫) | Longtan District (Taoyuan City) | June 1964 |
| Baihe Reservoir (baihe shuiku 白河水庫) | Baihe District (Tainan City) | June 1965 |
| Mingte Reservoir (mingde shuiku 明德水庫) | Touwu Township (Miaoli County) | May 1970 |
| Tsengwen Reservoir (zengwen shuiku 曾文水庫) | Dapu Township (Chiayi County) | October 1973 |
| Techi Reservoir (deji shuiku 德基水庫) | Heping District (Taichung City) | September 1974 |
| Hsinshan Reservoir (xinshan shuiku 新山水庫) | Anle District (Keelung City) | October 1980 |
| Yongheshan Reservoir (yongheshan shuiku 永和山水庫) | Sanwan Township (Miaoli County) | October 1984 |
| Baoshan Reservoir (Baoshan shuiku 寶山水庫) | Baoshan Township (Hsinchu County) | June 1985 |
| Feitsui Reservoir (feicui shuiku 翡翠水庫) | Shiding District (New Taipei City) | June 1987 |
| Renyitan Reservoir (renyitan shuiku 仁義潭水庫) | Fanlu Township (Chiayi County) | August 1987 |
| Liyutan Reservoir (liyutan shuiku 鯉魚潭水庫) | Sanyi Township (Miaoli County) | November 1992 |
| Nanhua Reservoir (Nanhua shuiku 南化水庫) | Nanhua District (Tainan City) | November 1993 |
| Mudan Reservoir (Mudan shuiku 牡丹水庫) | Mudan Township (Pingtung County) | May 1995 |
| Second Baoshan Reservoir (Baoshan dier shuiku 寶山第二水庫) | Baoshan Township (Hsinchu County) | June 2006 |
TOP HOME [◆ Geography/climate] [Rivers + lakes]
Smaller islands in the Taiwan area
- Penghu
- Kinmen
- Matsu
- Other islands close to Taiwan proper
- South China Sea
- Further information on selected ROC-controlled islands
- Alphabetical small islands index
 Since the ROC central government was forced to give up the Chinese mainland in 1949 and the Dachen
Islands (Zhejiang Province) in 1955, the territory controlled by the ROC has been
limited to the main island of Taiwan with a few small islets close to its shores plus the archipelagoes of Penghu, Kinmen,
and Matsu (Tai Peng Jin Ma 台澎金馬). Therefore the ROC territory has
also been dubbed "Taiwan area" (Taiwan diqu 台灣地區 or Taiwan quyu 台灣區域), and Taiwan proper with
an area of 35,879 km² constitutes the bulk of it. Also under ROC control are two areas in the South China Sea (nanhai 南海).
Since the ROC central government was forced to give up the Chinese mainland in 1949 and the Dachen
Islands (Zhejiang Province) in 1955, the territory controlled by the ROC has been
limited to the main island of Taiwan with a few small islets close to its shores plus the archipelagoes of Penghu, Kinmen,
and Matsu (Tai Peng Jin Ma 台澎金馬). Therefore the ROC territory has
also been dubbed "Taiwan area" (Taiwan diqu 台灣地區 or Taiwan quyu 台灣區域), and Taiwan proper with
an area of 35,879 km² constitutes the bulk of it. Also under ROC control are two areas in the South China Sea (nanhai 南海).
Furthermore, the ROC claims the Diaoyutai Islands in the East China Sea (donghai 東海) which are actually controlled by Japan. More information about the Diaoyutai Islands can be found here. For information about Taiwan's administrative subdivisions go to the page "Local administration" of this website.
TOP HOME [◆ Geography/climate] [Smaller islands]
Penghu
 The Penghu Archipelago (penghu qundao 澎湖群島) is also known by the name "Pescadores"
and consists of some 64 Islands, many of them uninhabited. The main island is Penghu proper (Penghu bendao
澎湖本島) [65.413 km²] {1} which is subdivided into two townships: Huxi Township
and Magong City. Other islands and islets include the following:
The Penghu Archipelago (penghu qundao 澎湖群島) is also known by the name "Pescadores"
and consists of some 64 Islands, many of them uninhabited. The main island is Penghu proper (Penghu bendao
澎湖本島) [65.413 km²] {1} which is subdivided into two townships: Huxi Township
and Magong City. Other islands and islets include the following:
- Hsiyu (xiyu 西嶼) aka Yuweng (yuweng dao 漁翁島) [17.838 km²] {2}—Xiyu Township
- Paisha (baisha dao 白沙島) [13.876 km²] {3}—Baisha Township
- Chimei (qimeiyu 七美嶼) [7.589 km²] {4}—Qimei Township
- Wang'an (wang'an dao 望安島) aka Pachao Island (bazhao dao 八罩島) [6.741 km²] {5}—Wangan Township
- Jibei (jibeiyu 吉貝嶼) [3.057 km²] {6}—Baisha Township
- Hujing (hujingyu 虎井嶼) [1.997 km²] {7}—Magong City
- Dongji (dongjiyu 東吉嶼) [1.771 km²] {8}—Wangan Township
- Jiangjun'ao (jiangjun aoyu 將軍澳嶼) [1.561 km²] {9}—Wangan Township
- Zhongtun (zhongtunyu 中屯嶼) [1.407 km²] {10}—Baisha Township
- Huayu (huayu 花嶼) [1.273 km²] {11}—Wangan Township
- Xiji (xijiyu 西吉嶼) [0.8967 km²] {12}—Wangan Township
- Dongyuping (dongyupingyu 東嶼坪嶼) [0.479 km²]—Wangan Township
- Xiaomen (xiaomenyu 小門嶼) [0.473 km²]—Xiyu Township
- Xiyuping (xiyupingyu 西嶼坪嶼) [0.3477 km²]—Wangan Township
- Niaoyu (niaoyu 鳥嶼) [0.3472 km²]—Baisha Township
- Tongpan (tongpanyu 桶盤嶼) [0.298 km²]—Magong City
- Gupo (gupoyu 姑婆嶼) [0.282 km²]—Baisha Township
- Yuanbei (yuanbeiyu 員貝嶼) [0.251 km²]—Baisha Township
- Dacang (dacangyu 大倉嶼) [0.190 km²]—Baisha Township
- Baisha (baishayu 白沙嶼) [0.1885 km²]—Baisha Township
- Tsaoyu (caoyu 草嶼) [0.1821 km²]—Wangan Township
- Chutou (chutouyu 鋤頭嶼) [0.1471 km²]—Wangan Township
- Dinggou (dinggouyu 錠鉤嶼) [0.0593 km²]—Huxi Township
- Chamu (chamuyu 查母嶼) [0.0383 km²]—Huxi Township
- Mudou (mudouyu 目斗嶼) [0.0244 km²]—Baisha Township
- Jilong (jilongyu 雞籠嶼) [0.0243 km²]—Magong City
- Guoyu (guoyu 過嶼) [0.0044 km²]—Baisha Township
The location of the administrative subdivisions of Penghu County as listed below is shown on this map.
| Baisha Township 白沙鄉 884 ⒭ Huxi Township 湖西鄉 885 ⒭ Magong City 馬公市 880 |
Qimei Township 七美鄉 883 ⒭ Wang'an Township 望安鄉 882 ⒭ Xiyu Township 西嶼鄉 881 ⒭ |
The South Penghu Marine National Park (Penghu nanfang sidao guojia gongyuan 澎湖南方四島國家公園) consists mainly of the islets Dongji, Xiji, Dongyuping, Xiyuping, Chutou and others in Wangan Township, including their surrounding waters. Penghu proper, Chimei and Wang'an are equipped with an airstrip. A causeway leads from Penghu proper to Hsiyu via Zhongtun and Paisha, the other islands can only be accessed by boat, seaplane or helicopter.
The table below shows the distances from selected islands of the archipelago to Taiwan and the PRC (source: Google Earth).
| Island | ~ Taiwan | ~ PRC | Island | ~ Taiwan | ~ PRC | |
|---|---|---|---|---|---|---|
| Chamu | 40.27 km | 157.21 km | Jibei | 54.38 km | 131.76 km | |
| Chimei | 61.73 km | 166.89 km | Mudou | 57.45 km | 128.72 km | |
| Dongji | 40.58 km | 176.92 km | Paisha | 53.89 km | 131.82 km | |
| Hsiyu | 60.38 km | 133.04 km | Penghu proper | 43.66 km | 142.21 km | |
| Huayu | 79.45 km | 143.39 km | Tongpan | 61.02 km | 145.21 km | |
| Hujing | 58.90 km | 146.97 km | Wang'an | 60.04 km | 154.41 km | |
| Jiangjun'ao | 57.42 km | 158.72 km | Zhongtun | 54.13 km | 142.59 km |
For further information about Penghu county click here.
TOP HOME [◆ Geography/climate] [Smaller islands]
Kinmen
 Kinmen is also known under the name "Quemoy" in the West. The Kinmen Islands (jinmen qundao
金門群島) consist of 12 islands and islets, the main island being Big Kinmen (da jinmen 大金門) aka Kinmen Island
(jinmen dao 金門島) [134.25 km²] {1} which is also closest to PRC-controlled
territory—2.26 km off the island of Jiaoyu 角嶼 (Xiang'an District 翔安區, Xiamen City 廈門市, Fujian Province). Big Kinmen
is subdivided into four townships: Jincheng Township, Jinhu Township, Jinning Township, and Jinsha Township. Other islets
include the following:
Kinmen is also known under the name "Quemoy" in the West. The Kinmen Islands (jinmen qundao
金門群島) consist of 12 islands and islets, the main island being Big Kinmen (da jinmen 大金門) aka Kinmen Island
(jinmen dao 金門島) [134.25 km²] {1} which is also closest to PRC-controlled
territory—2.26 km off the island of Jiaoyu 角嶼 (Xiang'an District 翔安區, Xiamen City 廈門市, Fujian Province). Big Kinmen
is subdivided into four townships: Jincheng Township, Jinhu Township, Jinning Township, and Jinsha Township. Other islets
include the following:
- Little Kinmen (xiao jinmen 小金門) aka Lieh Yu (lieyu 烈嶼) [14.85 km²] {2}—Lieyu Township
- Ta-tan Island (dadan dao 大膽島) [0.97 km²] {3}—Lieyu Township
- Ertan Island (erdan dao 二膽島) [0.28 km²] {4}—Lieyu Township
- Peiting (beiding dao 北碇島) [0.08 km²]—Jinhu Township
- Fuhsing Islet (fuxing yu 復興嶼) [0.05 km²]—Lieyu Township
- Menghuyu (menghu yu 猛虎嶼) [0.025 km²]—Lieyu Township
- Binlang Islet (binlang yu 檳榔嶼 [0.0208 km²]—Lieyu Township
- Tungting (dongding dao 東碇島) [0.016 km²]—Jincheng Township
- Shihyu (shiyu 獅嶼) [0.007 km²]—Lieyu Township
- Jiangong Islet (jiangongyu 建功嶼) [0.0005 km²]—Jincheng Township
The location of the administrative subdivisions of Kinmen County as listed below is shown on this map.
| Jincheng Township 金城鎮 893 ⒰ Jinhu Township 金湖鎮 891 ⒰ Jinning Township 金寧鄉 892 ⒭ |
Jinsha Township 金沙鎮 890 ⒰ Lieyu Township 烈嶼鄉 894 ⒭ Wuqiu Township 烏坵鄉 896 ⒭ |
Some very tiny islets of the Kinmen Islands, although named, are actually little more than rocks in the ocean, e. g. Houtou 後頭嶼, Yanyu 烟嶼, Sanjiao Reef 三角礁, and Guizi Reef 桂子礁, and reliable data concerning their size are not available. In particular, in the vicinity of Ertan Island there are some additional tiny islets and rocks as well, including Santan 三膽島, Sitan 四膽, and Wutan 五膽, but online sources provide no information about their respective sizes either. According to some sources, Ta-tan Island, Ertan Island, Santan, Sitan and Wutan combined cover less than 1.5 km².
 Two additional islets—Daqiu (daqiu yu 大坵嶼) [0.71 km²] and Xiaoqiu (xiaoqiu
yu 小坵嶼) [0.4 km²]—administratively belong to Wuqiu Township in Kinmen County but geographically should
not be considered being a part of the Kinmen Islands as they are located more than 100 km away from the closest
island Big Kinmen. The position of Wuqiu Township in the Taiwan Strait about halfway between Kinmen and Matsu off
the PRC is shown here.
Two additional islets—Daqiu (daqiu yu 大坵嶼) [0.71 km²] and Xiaoqiu (xiaoqiu
yu 小坵嶼) [0.4 km²]—administratively belong to Wuqiu Township in Kinmen County but geographically should
not be considered being a part of the Kinmen Islands as they are located more than 100 km away from the closest
island Big Kinmen. The position of Wuqiu Township in the Taiwan Strait about halfway between Kinmen and Matsu off
the PRC is shown here.
 Big Kinmen—equipped with an airstrip—and Little Kinmen are connected by the Kinmen Bridge
(Jinmen daqiao 金門大橋) with a length of 5.4 km, linking Jinning Township 金寧鄉 and Lieyu Township 烈嶼鄉.
The bridge was under construction since May 2012 and opened to traffic on Oct. 30, 2022. The other islands can
only be accessed by boat, seaplane or helicopter.
Big Kinmen—equipped with an airstrip—and Little Kinmen are connected by the Kinmen Bridge
(Jinmen daqiao 金門大橋) with a length of 5.4 km, linking Jinning Township 金寧鄉 and Lieyu Township 烈嶼鄉.
The bridge was under construction since May 2012 and opened to traffic on Oct. 30, 2022. The other islands can
only be accessed by boat, seaplane or helicopter.
The table below shows the distances from selected islands of the archipelago to Taiwan and the PRC (source: Google Earth). The map on the right further illustrates the proximity of the outlying islands of Kinmen to the PRC, with the PRC territory marked in red.
| Island | ~ Taiwan | ~ PRC |  |
|---|---|---|---|
| Daqiu | 131.63 km | 15.70 km | |
| Ertan | 214.47 km | 4.41 km | |
| Kinmen Island | 187.31 km | 2.26 km | |
| Little Kinmen | 206.25 km | 4.80 km | |
| Peiting | 183.51 km | 11.47 km | |
| Shihyu | 210.89 km | 3.98 km | |
| Ta-tan | 213.64 km | 4.31 km | |
| Xiaoqiu | 129.61 km | 18.08 km |
Please note that the administration of Ta-tan Island and Ertan Island was transferred from the military to the Kinmen County government by the end of June 2014. Kinmen National Park (Jinmen guojia gongyuan 金門國家公園), formally established on Oct. 18, 1995, places an emphasis on cultural heritage preservation, while the other of Taiwan's national parks focus mainly on the protection of diverse ecosystems and natural resources.
For further information about Kinmen county click here.
TOP HOME [◆ Geography/climate] [Smaller islands]
Matsu
 The Matsu Islands (mazu liedao 馬祖列島) consist of 36 islands and islets. The largest island
is Nan'gan 南竿 [10.43 km²] {1}, constituting the main part of Nangan Township. Other
islands include the following:
The Matsu Islands (mazu liedao 馬祖列島) consist of 36 islands and islets. The largest island
is Nan'gan 南竿 [10.43 km²] {1}, constituting the main part of Nangan Township. Other
islands include the following:
- Beigan 北竿 [8.86 km²] {2}—Beigan Township
- Tungyin Island (dongyin dao 東引島) [3.22 km²] {3}—Dongyin Township
- Dongjyu (dongju 東莒) [2.64 km²] {4}—Juguang Township
- Sijyu (xiju 西莒) [2.37 km²] {5}—Juguang Township
- Kaoteng (gaodeng dao 高登島) [1.84 km²] {6}—Beigan Township
- Hsiyin (xiyin dao 西引島) [1.13 km²] {7}—Dongyin Township
- Liang Island (liangdao 亮島) [0.4 km²] {8}—Beigan Township
The location of the administrative subdivisions of Lienchiang County as listed below is shown on this map.
| Beigan Township 北竿鄉 210 ⒭ Dongyin Township 東引鄉 212 ⒭ |
Juguang Township 莒光鄉 211 ⒭ Nan'gan Township 南竿鄉 209 ⒭ |
Nan'gan and Beigan are equipped with an airstrip, the other islands can only be accessed by boat, seaplane or helicopter.
The table below shows the distances from selected islands of the archipelago to Taiwan and the PRC (source: Google Earth). The map on the right further illustrates the proximity of the outlying islands of Matsu to the PRC, with the PRC territory marked in red.
| Island | ~ Taiwan | ~ PRC |  |
|---|---|---|---|
| Beigan | 166.84 km | 12.42 km | |
| Dongjyu | 148.17 km | 25.41 km | |
| Hsiyin | 157.78 km | 30.41 km | |
| Kaoteng | 173.22 km | 8.95 km | |
| Liang Island | 166.42 km | 18.22 km | |
| Nan'gan | 165.32 km | 15.67 km | |
| Sijyu | 152.09 km | 21.29 km | |
| Tungyin | 155.52 km | 31.68 km |
For further information about Lienchiang county (Matsu's administrative name) click here.
TOP HOME [◆ Geography/climate] [Smaller islands]
Other islands close to Taiwan proper
Close to the shores of Taiwan proper there are the following islets:
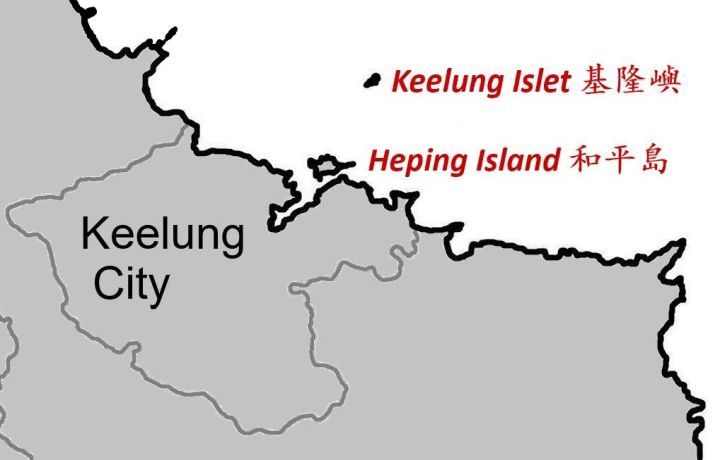
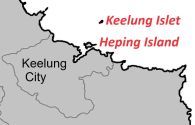 Keelung City—Huaping (huaping yu 花瓶嶼)
[0.03 km²] {1}, Mianhua (mianhua yu 棉花嶼) [0.13 km²] {2}, and Pengjia (pengjia yu 彭佳嶼) [1.14 km²] {3}.
Huaping, Mianhua and Pengjia form a group collectively known as the Three Northern Islets (beifang sandao 北方三島).
Keelung City—Huaping (huaping yu 花瓶嶼)
[0.03 km²] {1}, Mianhua (mianhua yu 棉花嶼) [0.13 km²] {2}, and Pengjia (pengjia yu 彭佳嶼) [1.14 km²] {3}.
Huaping, Mianhua and Pengjia form a group collectively known as the Three Northern Islets (beifang sandao 北方三島).
In addition, two small islets not shown on below map titled "Northern Taiwan" are within the jurisdiction of Keelung City's Zhongzheng District (202): Heping Island (heping dao 和平島), [0.663 km²] 76 m off Keelung harbour, and tiny Keelung Islet (jilong yu 基隆嶼) [23.91 ha] 3.9 km off Taiwan's coast.- Yilan County—Guishan Island (guishan dao 龜山島) aka Kueishan Island/Turtle Island [2.841 km²] {4}.
- Taitung County—Green Island/Lyudao (lüdao 綠島) [15.1 km²] {5} and Orchid Island (Lanyu 蘭嶼) aka "Ponso no Tao" [48.38 km²] {6} plus Little Lanyu (xiao Lanyu 小蘭嶼) aka "Jimagaod" [1.75 km²] {7} 5.6 km off Orchid Island. Restrictions to visit Lanyu, imposed by the Japanese, were lifted in 1967.
- Pingtung County—Liuchiu Island (liuqiu yu 琉球嶼) aka Siaoliouciou (xiao liuqiu 小琉球)/Lamay Island/Lambai Island/Gold Lion Island [6.802 km²] {8}. A constellation of coral reefs called "Seven Star Reef" (qixingyan 七星岩) aka "Vele Rete rocks" ca. 8 nautical miles (15 km) off Eluanbi 鵝鑾鼻 is not considered to be islands.
— — — Maps of islands close to Taiwan proper — — —


—————————— —————————— —————————— —————————— ——————————
 |  |  |  |
—————————— —————————— —————————— —————————— ——————————
 |  |  | The ten maps shown here do not have a uniform scale. |
Note: Green Island and Orchid Island are equipped with an airstrip, the other islands can only be accessed by boat, seaplane or helicopter. Green Island originally had an indigenous population of Amis and Yami aborigines, Han Chinese settlers began moving there in the 19th century during the Qing dynasty.
TOP HOME [◆ Geography/climate] [Smaller islands]
South China Sea
 The South China Sea (nanhai 南海) is formally claimed by
the ROC in its entirety, but in fact the ROC controls only two small areas there—the Pratas
Islands and Taiping Island, the latter being part of the Spratly Islands (nansha
qundao 南沙群島).
The South China Sea (nanhai 南海) is formally claimed by
the ROC in its entirety, but in fact the ROC controls only two small areas there—the Pratas
Islands and Taiping Island, the latter being part of the Spratly Islands (nansha
qundao 南沙群島).
The Pratas Islands and the Spratlys (aka Coral Islands) are disputed—the Pratas Islands are claimed by the ROC and the PRC; the Spratlys in total by the PRC, ROC, and Vietnam, in part by Brunei, Malaysia and the Philippines. In addition, the ROC explicitly claims the following island groups in the South China Sea but does not control any part of them—Macclesfield Bank (zhongsha qundao 中沙群島) and Paracel Islands (xisha qundao 西沙群島).
Please note that the ROC began claiming the Spratly Islands as its territory only after the end of WWII. According to Chapter 1 in the China Handbook 1937-1943, published by the Chinese Ministry of Information in 1943, ROC territory in the south extended to Triton Island (Zhongjian dao 中建島) of the Paracel Group.
 The Pratas Islands (dongsha qundao 東沙群島) [2.4 km²] aka Dongsha Atoll include
Pratas Island (dongsha dao 東沙島) [1.74 km²] where the ROC armed forces operate an airfield with a
1,550 m runway, North Vereker Bank (beiweitan 北衛灘), and South Vereker Bank (nanweitan 南衛灘).
The Pratas Islands (dongsha qundao 東沙群島) [2.4 km²] aka Dongsha Atoll include
Pratas Island (dongsha dao 東沙島) [1.74 km²] where the ROC armed forces operate an airfield with a
1,550 m runway, North Vereker Bank (beiweitan 北衛灘), and South Vereker Bank (nanweitan 南衛灘).
 Taiping (taiping dao 太平島) [0.49 km²] aka Itu Aba is the largest naturally formed island
of the Spratly Islands. The armed forces of the ROC established a permanent presence on that islet on July 11, 1956. An
airfield with a 1,200 m runway was completed on Dec. 12, 2007, and a new lighthouse and wharf were inaugurated on Dec. 12,
2015. The island was visited by ROC presidents twice—by Chen Shui-bian on Feb. 2, 2008
and by Ma Ying-jeou on Jan. 28, 2016.
Taiping (taiping dao 太平島) [0.49 km²] aka Itu Aba is the largest naturally formed island
of the Spratly Islands. The armed forces of the ROC established a permanent presence on that islet on July 11, 1956. An
airfield with a 1,200 m runway was completed on Dec. 12, 2007, and a new lighthouse and wharf were inaugurated on Dec. 12,
2015. The island was visited by ROC presidents twice—by Chen Shui-bian on Feb. 2, 2008
and by Ma Ying-jeou on Jan. 28, 2016.
Taiping was listed as an important military-controlled area (zhongyao junshi sheshi guanzhiqu
重要軍事設施管制區) by the ROC MND in 2000, and a regulation drafted by the MND and
CGA on who is allowed to enter the area was imposed in 2013. Accordingly, four kinds
of civilians are permitted to access the area after their requests are approved—
1) those who perform public duty and participate in affairs of defense and security,
2) those who are in industrial or commercial organizations having contracts with the MND and participate in affairs of
defense and security,
3) foreign nationals who conduct or participate in affairs of defense and security, and
4) people who conduct equipment maintenance or do academic research.
The MND's Air Force Command (guofangbu kongjun silingbu 國防部空軍司令部) is the agency to decide if a request is
approved or not.
On July 12, 2016, the Permanent Court of Arbitration (PCA), based in the Dutch city The Hague, ruled that Taiping is legally a "rock" under international law and not an island, a verdict strongly rejected by the ROC government. Interestingly, claims by leading politicians in both camps in Taiwan concerning ROC sovereignty over the islands of the South China Sea and their surrounding waters are identical, and they also agree that Taiping clearly meets the criteria of an island as defined in Article 121 of the U.N. Convention on the Law of the Sea (UNCLOS). UNCLOS was done at Montego Bay (Jamaica) on Dec. 10, 1982 and entered into force on Nov. 16, 1994. Article 121 deals with the "Regime of islands" and reads as follows:
- An island is a naturally formed area of land, surrounded by water, which is above water at high tide.
- Except as provided for in paragraph 3, the territorial sea, the contiguous zone, the exclusive economic zone (EEZ) and the continental shelf of an island are determined in accordance with the provisions of this Convention applicable to other land territory.
- Rocks which cannot sustain human habitation or economic life of their own shall have no EEZ or continental shelf.
TOP HOME [◆ Geography/climate] [Smaller islands]
Further information on selected ROC-controlled islands
The table below lists the coordinates of selected islands, reference point is the middle of the respective island. (Source: Google Earth)
| Island | Area | Latitude | Longitude | |
|---|---|---|---|---|
| Beigan 北竿 (Matsu) | 8.86 km² | 26° 13' 19" N | 119° 59' 00" E | |
| Chamu 查母嶼 (Penghu) | 0.038 km² | 23° 32' 17" N | 119° 43' 30" E | |
| Chimei 七美嶼 (Penghu) | 7.589 km² | 23° 12' 23" N | 119° 25' 43" E | |
| Daqiu 大坵嶼 (Kinmen County) | 0.71 km² | 24° 59' 32" N | 119° 27' 07" E | |
| Dongji 東吉嶼 (Penghu) | 1.771 km² | 23° 15' 14" N | 119° 40' 14" E | |
| Dongjyu 東莒 (Matsu) | 2.64 km² | 25° 57' 37" N | 119° 58' 26" E | |
| Ertan 二膽島 (Kinmen) | 0.28 km² | 24° 22' 49" N | 118° 09' 26" E | |
| Green Island / Lyudao 綠島 (Taitung County) | 15.1 km² | 22° 39' 34" N | 121° 29' 30" E | |
| Guishan Island 龜山島 (Yilan County) | 2.84 km² | 24° 50' 34" N | 121° 57' 09" E | |
| Heping Island 和平島 (Keelung City) | 0.663 km² | 25° 09' 31" N | 121° 45' 57" E | |
| Hsiyin 西引島 (Matsu) | 1.13 km² | 26° 22' 37" N | 120° 28' 44" E | |
| Hsiyu 西嶼 (Penghu) | 17.838 km² | 23° 36' 03" N | 119° 30' 39" E | |
| Huaping 花瓶嶼 (Three Northern Islets) | 0.03 km² | 25° 25' 26" N | 121° 56' 46" E | |
| Huayu 花嶼 (Penghu) | 1.273 km² | 23° 24' 17" N | 119° 19' 23" E | |
| Hujing 虎井嶼 (Penghu) | 1.997 km² | 23° 29' 25" N | 119° 31' 38" E | |
| Jiangjun'ao 將軍澳嶼 (Penghu) | 1.561 km² | 23° 22' 06" N | 119° 31' 52" E | |
| Jibei 吉貝嶼 (Penghu) | 3.057 km² | 23° 44' 42" N | 119° 36' 46" E | |
| Kaoteng 高登島 (Matsu) | 1.84 km² | 26° 16' 30" N | 119° 59' 21" E | |
| Keelung Islet 基隆嶼 (Keelung City) | 0.2391 km² | 25° 11' 32" N | 121° 47' 08" E | |
| Kinmen Island 金門島 (Kinmen) | 134.25 km² | 24° 27' 02" N | 118° 22' 58" E | |
| Liang 亮島 (Matsu) | 0.4 km² | 26° 20' 27" N | 120° 13' 33" E | |
| Little Kinmen 小金門 (Kinmen) | 14.85 km² | 24° 25' 55" N | 118° 14' 39" E | |
| Little Lanyu 小蘭嶼 (Taitung County) | 1.75 km² | 21° 56' 58" N | 121° 36' 36" E | |
| Liuchiu Island 琉球嶼 (Pingtung County) | 6.8 km² | 22° 20' 35" N | 120° 22' 26" E | |
| Mianhua 棉花嶼 (Three Northern Islets) | 0.13 km² | 25° 29' 06" N | 122° 06' 19" E | |
| Mudou 目斗嶼 (Penghu) | 0.024 km² | 23° 47' 10" N | 119° 36' 01" E | |
| Nan'gan 南竿 (Matsu) | 10.43 km² | 26° 09' 08" N | 119° 56' 06" E | |
| Orchid Island / Lanyu 蘭嶼 (Taitung County) | 48.38 km² | 22° 03' 17" N | 121° 32' 27" E | |
| Paisha 白沙島 (Penghu) | 13.786 km² | 23° 29' 26" N | 119° 35' 11" E | |
| Peiting 北碇島 (Kinmen) | 0.08 km² | 24° 25' 37" N | 118° 30' 17" E | |
| Penghu proper 澎湖本島 (Penghu) | 65.413 km² | 23° 33' 50" N | 119° 37' 49" E | |
| Pengjia 彭佳嶼 (Three Northern Islets) | 1.14 km² | 25° 37' 42" N | 122° 04' 44" E | |
| Pratas Island 東沙島 | ⚔ | 1.74 km² | 20° 42' 05" N | 116° 43' 43" E |
| Shihyu 獅嶼 (Kinmen) | 0.007 km² | 24° 27' 20" N | 118° 13' 37" E | |
| Sijyu 西莒 (Matsu) | 2.37 km² | 25° 58' 34" N | 119° 56' 06" E | |
| Ta-tan 大膽島 (Kinmen) | 0.97 km² | 24° 23' 22" N | 118° 09' 49" E | |
| Taiping 太平島 (Spratly Islands) | ⚔ | 0.49 km² | 10° 22' 37" N | 114° 21' 54" E |
| Tongpan 桶盤嶼 (Penghu) | 0.298 km² | 23° 30' 42" N | 119° 31' 04" E | |
| Tungyin 東引島 (Matsu) | 3.22 km² | 26° 22' 03" N | 120° 29' 35" E | |
| Wang'an 望安島 (Penghu) | 6.741 km² | 23° 22' 04" N | 119° 30' 06" E | |
| Xiaoqiu 小坵嶼 (Kinmen County) | 0.4 km² | 24° 58' 59" N | 119° 28' 22" E | |
| Zhongtun 中屯嶼 (Penghu) | 1.407 km² | 23° 36' 56" N | 119° 36' 27" E | |
In addition to Taiwan proper (Taiwan bendao 台灣本島) with an area of 35,767.6263 km², twelve islands under the jurisdiction of the ROC are larger than 4 square kilometers.
| Island | Area (km²) | Island | Area (km²) | |
|---|---|---|---|---|
| Kinmen Island (Kinmen) | 134.25 | Paisha (Penghu) | 13.786 | |
| Penghu proper (Penghu) | 65.413 | Nan'gan (Matsu) | 10.43 | |
| Orchid Island / Lanyu (Taitung County) | 48.38 | Beigan (Matsu) | 8.86 | |
| Hsiyu (Penghu) | 17.838 | Chimei (Penghu) | 7.589 | |
| Green Island / Lyudao (Taitung County) | 15.1 | Liuchiu Island (Pingtung County) | 6.8 | |
| Little Kinmen (Kinmen) | 14.85 | Wang'an (Penghu) | 6.741 |
Next, the column on the right shows the respective distance to Taiwan proper.
| Name | Under administration of | Population / Remarks | ~ Taiwan | |
|---|---|---|---|---|
| Daqiu | Wuqiu Township (Kinmen County) | Regular civilian population | 131.63 km | |
| Green Island | Ludao Township (Taitung County) | Regular civilian population | 30.22 km | |
| Guishan Island | Toucheng Township (Yilan County) | Uninhabited since 1977 | 9.13 km | |
| Heping Island | Zhongzheng District (Keelung City) | Regular civilian population | 0.076 km | |
| Huaping | Zhongzheng District (Keelung City) | Uninhabited | 33.60 km | |
| Keelung Islet | Zhongzheng District (Keelung City) | No permanent regular population, but CGA personnel | 3.9 km | |
| Little Lanyu | Lanyu Township (Taitung County) | Uninhabited | 73.26 km | |
| Liuchiu Island | Liuqiu Township (Pingtung County) | Regular civilian population | 12.68 km | |
| Mianhua | Zhongzheng District (Keelung City) | Uninhabited | 47.69 km | |
| Orchid Island | Lanyu Township (Taitung County) | Regular civilian population | 62.22 km | |
| Pengjia | Zhongzheng District (Keelung City) | No permanent population, CGA and marine scientists | 59.30 km | |
| Pratas Islands | ⚔ | Qijin District (Kaohsiung City) | No permanent population, CGA and marine scientists | 422 km |
| Taiping | ⚔ | Qijin District (Kaohsiung City) | No permanent population, CGA / military and marine scientists | 1,446 km |
| Xiaoqiu | Wuqiu Township (Kinmen County) | Regular civilian population | 129.61 km | |
The table below lists the 3-digit postal codes of selected islands administered, controlled or claimed by the ROC (islands and islets belonging to the archipelagos of Penghu, Kinmen and Matsu not included).
| Island(s) | Postal code | City / county | District | |
|---|---|---|---|---|
| Diaoyutai 釣魚台 | ⚔ | 290 | Yilan County | Toucheng Township |
| Guishan Island | 261 | Yilan County | Toucheng Township | |
| Heping Island | 202 | Keelung City | Zhongzheng District | |
| Keelung Islet | 202 | Keelung City | Zhongzheng District | |
| Lanyu (Orchid Island) | 952 | Taitung County | Lanyu Township | |
| Liuchiu Island | 929 | Pingtung County | Liuqiu Township | |
| Lyudao (Green Island) | 951 | Taitung County | Ludao Township | |
| Pratas Island | ⚔ | 817 | Kaohsiung City | Qijin District |
| Taiping | ⚔ | 819 | Kaohsiung City | Qijin District |
| Three Northern Islets | 202 | Keelung City | Zhongzheng District | |
TOP HOME [◆ Geography/climate] [Smaller islands]
Alphabetical small islands index
A list of all smaller islands mentioned on this page in alphabetical order is shown directly below.
Beigan 北竿———Beigan Township, Matsu (Lienchiang County)
Bei Island 北小島———Diaoyutai (Yilan County) ⚔
Chamu 查母嶼———Huxi Township, Penghu (Penghu County)
Chimei 七美嶼———Qimei Township, Penghu (Penghu County)
Chiwei Island 赤尾嶼———Diaoyutai (Yilan County) ⚔
Chongbei Islet 沖北岩———Diaoyutai (Yilan County) ⚔
Chongnan Islet 沖南岩———Diaoyutai (Yilan County) ⚔
Chutou 鋤頭嶼———Wangan Township, Penghu (Penghu County)
Dacang 大倉嶼———Baisha Township, Penghu (Penghu County)
Daqiu 大坵嶼———Wuqiu Township (Kinmen County)
Diaoyutai Island 釣魚台———Diaoyutai (Yilan County) ⚔
Dinggou 錠鉤嶼———Huxi Township, Penghu (Penghu County)
Dongji 東吉嶼———Wangan Township, Penghu (Penghu County)
Dongjyu 東莒———Juguang Township, Matsu (Lienchiang County)
Dongyuping 東嶼坪嶼———Wangan Township, Penghu (Penghu County)
Ertan 二膽島———Lieyu Township, Kinmen (Kinmen County)
Feilai Islet 飛瀨———Diaoyutai (Yilan County) ⚔
Green Island / Lyudao 綠島———Ludao Township (Taitung County)
Guishan Island 龜山島———Toucheng Township (Yilan County)
Guoyu 過嶼———Baisha Township, Penghu (Penghu County)
Heping Island 和平島———Zhongzheng District, Keelung (Keelung City)
Hsiyin 西引島———Dongyin Township, Matsu (Lienchiang County)
Hsiyu 西嶼———Xiyu Township, Penghu (Penghu County)
Huangwei Island 黃尾嶼———Diaoyutai (Yilan County) ⚔
Huaping 花瓶嶼———Three Northern Islets, Zhongzheng District (Keelung City)
Huayu 花嶼———Wangan Township, Penghu (Penghu County)
Hujing 虎井嶼———Magong City, Penghu (Penghu County)
Jiangong Islet 建功嶼———Jincheng Township, Kinmen (Kinmen County)
Jiangjun'ao 將軍澳嶼———Wangan Township, Penghu (Penghu County)
Jibei 吉貝嶼———Baisha Township, Penghu (Penghu County)
Jilong 雞籠嶼———Magong City, Penghu (Penghu County)
Kaoteng 高登島———Beigan Township, Matsu (Lienchiang County)
Keelung Islet 基隆嶼———Zhongzheng District, Keelung (Keelung City)
Kinmen Island 金門島———Kinmen (Kinmen County)
Liang 亮島———Beigan Township, Matsu (Lienchiang County)
Little Kinmen 小金門———Lieyu Township, Kinmen (Kinmen County)
Little Lanyu 小蘭嶼———Lanyu Township (Taitung County)
Liuchiu Island 琉球嶼———Liuqiu Township (Pingtung County)
Menghuyu 猛虎嶼———Lieyu Township, Kinmen (Kinmen County)
Mianhua 棉花嶼———Three Northern Islets, Zhongzheng District (Keelung City)
Mudou 目斗嶼———Baisha Township, Penghu (Penghu County)
Nan'gan 南竿———Nangan Township, Matsu (Lienchiang County)
Nan Island 南小島———Diaoyutai (Yilan County) ⚔
Niaoyu 鳥嶼———Baisha Township, Penghu (Penghu County)
Orchid Island / Lanyu 蘭嶼———Lanyu Township (Taitung County)
Paisha 白沙島———Baisha Township, Penghu (Penghu County)
Peiting 北碇島———Jinhu Township, Kinmen (Kinmen County)
Penghu proper 澎湖本島———Penghu (Penghu County)
Pengjia 彭佳嶼———Three Northern Islets, Zhongzheng District (Keelung City)
Pratas Island 東沙島———Pratas Islands, South China Sea (Qijin District, Kaohsiung City) ⚔
Shihyu 獅嶼———Lieyu Township, Kinmen (Kinmen County)
Sijyu 西莒———Juguang Township, Matsu (Lienchiang County)
Ta-tan 大膽島———Lieyu Township, Kinmen (Kinmen County)
Taiping 太平島———Spratly Islands, South China Sea (Qijin District, Kaohsiung City) ⚔
Tongpan 桶盤嶼———Magong City, Penghu (Penghu County)
Tungting 東碇島———Jincheng Township, Kinmen (Kinmen County)
Tungyin 東引島———Dongyin Township, Matsu (Lienchiang County)
Wang'an 望安島———Wangan Township, Penghu (Penghu County)
Xiaomen 小門嶼———Xiyu Township, Penghu (Penghu County)
Xiaoqiu 小坵嶼———Wuqiu Township (Kinmen County)
Xiji 西吉嶼———Wangan Township, Penghu (Penghu County)
Xiyuping 西嶼坪嶼———Wangan Township, Penghu (Penghu County)
Yuanbei 員貝嶼———Baisha Township, Penghu (Penghu County)
Zhongtun 中屯嶼———Baisha Township, Penghu (Penghu County)
Please note that due to their size, the islands Kinmen and Penghu comprise more than one administrative subdivision—Kinmen: Jinsha Township, Jinhu Township, Jinning Township, and Jincheng Township; Penghu: Magong City and Huxi Township.
TOP HOME [◆ Geography/climate] [Smaller islands]
Geology: Faults, earthquakes, volcanism and more
Faults
Taiwan is situated at the seismically active Pacific Rim which is also called "Ring of Fire", and the island is criss-crossed by dozens of faults, resulting in frequent earthquakes. Major research on Taiwan's faults is done by the Geological Survey and Mining Management Agency (GSMMA) under the MOEA. On Jan. 4, 2022 the Central Geological Survey (CGS, i. e. the predecessor agency of GSMMA) published a study (including a map with versions in English and Chinese) on known faults in Taiwan, recording a total of 36 active faults across the island (see following list).
- Sanchiao Fault (shanjiao duanceng 山腳斷層),
- Hukou Fault (hukou duanceng 湖口斷層),
- Hsinchu Fault (xinzhu duanceng 新竹斷層),
- Hsincheng Fault (xincheng duanceng 新城斷層),
- Shihtan Fault (shitan duanceng 獅潭斷層),
- Sanyi Fault (sanyi duanceng 三義斷層),
- Tachia Fault (dajia duanceng 大甲斷層),
- Tiehchenshan Fault (tiezhanshan duanceng 鐵砧山斷層),
- Tuntzuchiao Fault (tunzijiao duanceng 屯子腳斷層),
- Changhua Fault (zhanghua duanceng 彰化斷層),
- Chelungpu Fault (chelongpu duanceng 車籠埔斷層),
- Tamaopu-Shuangtung Fault (damaopu shuangdong duanceng 大茅埔 - 雙冬斷層),
- Chuhsiang Fault (chuxiang duanceng 初鄉斷層),
- Chiuchiungkeng Fault (jiuqiongkeng duanceng 九芎坑斷層),
- Meishan Fault (meishan duanceng 梅山斷層),
- Tachienshan Fault (dajianshan duanceng 大尖山斷層),
- Muchiliao Fault (mujiliao duanceng 木屐寮斷層),
- Liuchia Fault (liujia duanceng 六甲斷層),
- Chukou Fault (chukou duanceng 觸口斷層),
- Kouhsiaoli Fault (kouxiaoli duanceng 口宵里斷層),
- Hsinhua Fault (xinhua duanceng 新化斷層),
- Houchiali Fault (houjiali duanceng 後甲里斷層),
- Tsochen Fault (zuozhen duanceng 左鎮斷層),
- Hsiaokangshan Fault (xiaogangshan duanceng 小崗山斷層),
- Chekualin Fault (chegualin duanceng 車瓜林斷層),
- Chishan Fault (qishan duanceng 旗山斷層),
- Chaochou Fault (chaozhou duanceng 潮州斷層),
- Hengchun Fault (hengchun duanceng 恆春斷層),
- Milun Fault (milun duanceng 米崙斷層),
- Lingding Fault (lingding duanceng 嶺頂斷層),
- Rueyshui Fault (ruisui duanceng 瑞穗斷層),
- Chimei Fault (qimei duanceng 奇美斷層),
- Yuli Fault (yuli duanceng 玉里斷層),
- Chihshang Fault (chishang duanceng 池上斷層),
- Luyeh Fault (luye duanceng 鹿野斷層), and
- Lichi Fault (liji duanceng 利吉斷層).
Please note that the National Museum of Natural Science (NMNS) under the MOE operates a Chelungpu Fault Preservation Park 車籠埔斷層保存園區 in Nantou County's Zhushan 竹山.
TOP HOME [◆ Geography/climate] [Geology]
Earthquakes
- TABLE 1—List of major earthquakes in the Taiwan area since WWII (general overview)
- TABLE 2—Offshore earthquakes close to smaller islands near Taiwan proper
- TABLE 3—All temblors above magnitude 7 (in chronological order)
- TABLE 4—Taiwan's deadliest earthquakes (2 or more fatalities) since WWII
- TABLE 5—Taiwan's seismic hotspots
- TABLE 6—Milestones of seismology in Taiwan
 As a consequence of Taiwan's
geological features, earthquakes are common in and around the island (especially near the east coast). Other manifestations of
geological activity in this context are Taiwan's hot springs (wenquan 溫泉) and volcanism (huoshan 火山).
As a consequence of Taiwan's
geological features, earthquakes are common in and around the island (especially near the east coast). Other manifestations of
geological activity in this context are Taiwan's hot springs (wenquan 溫泉) and volcanism (huoshan 火山).
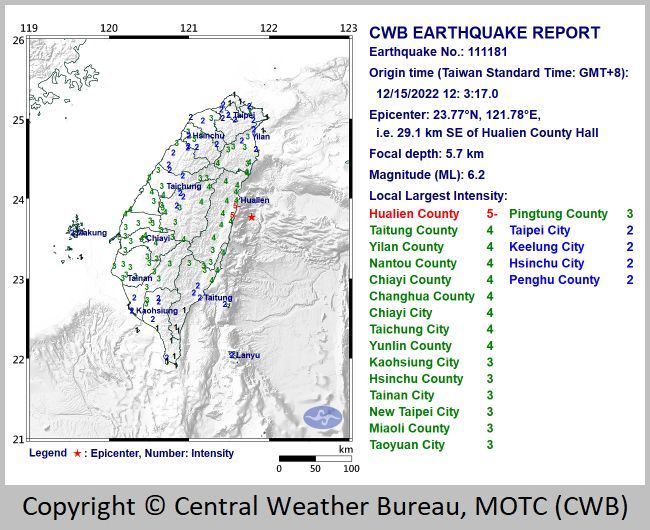
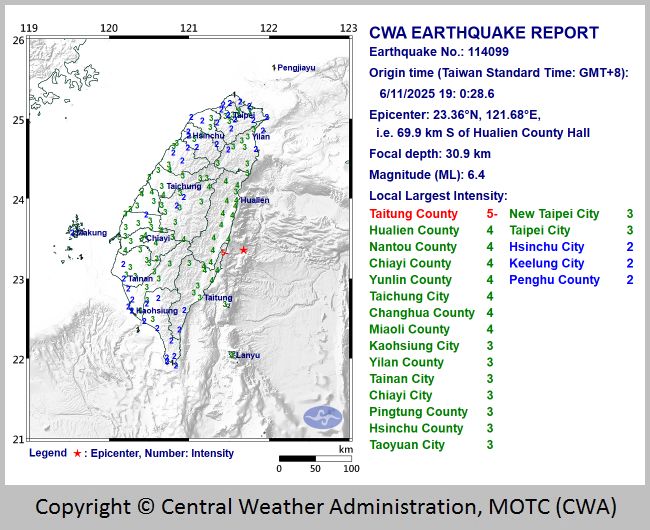
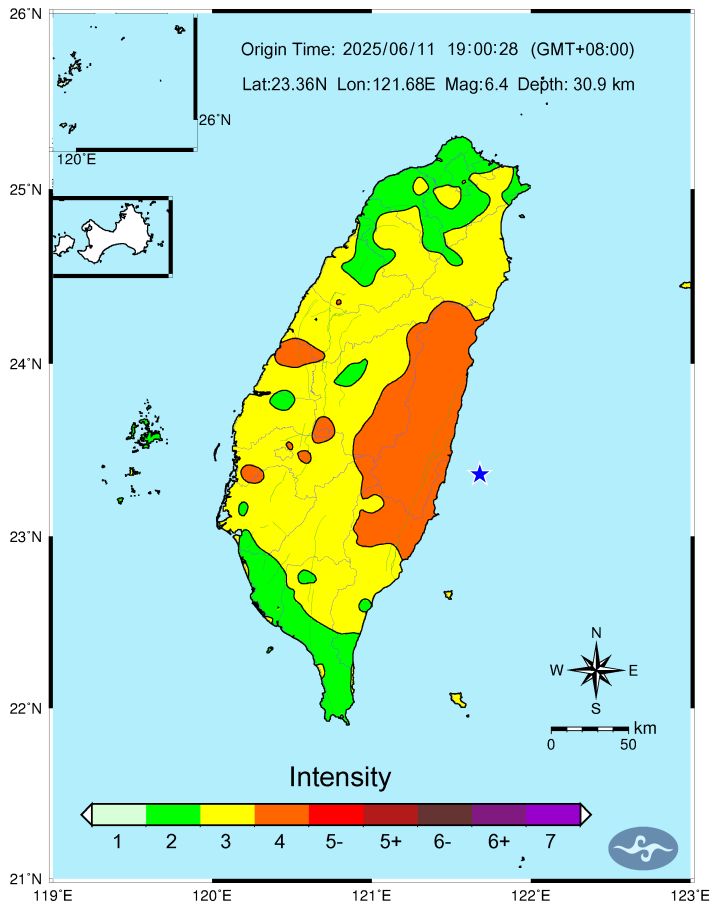
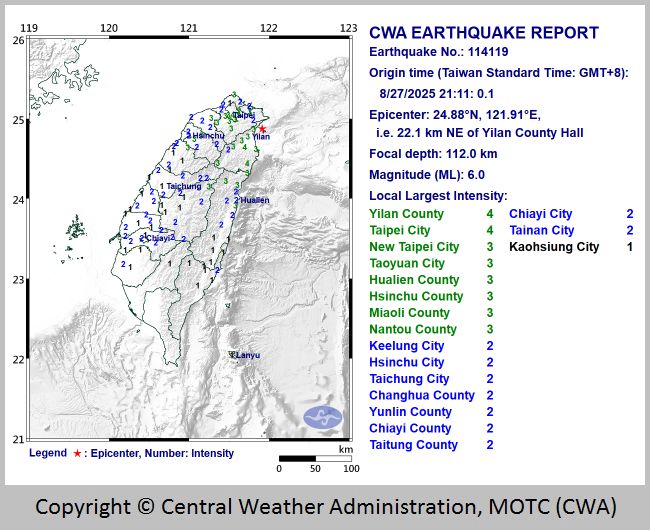
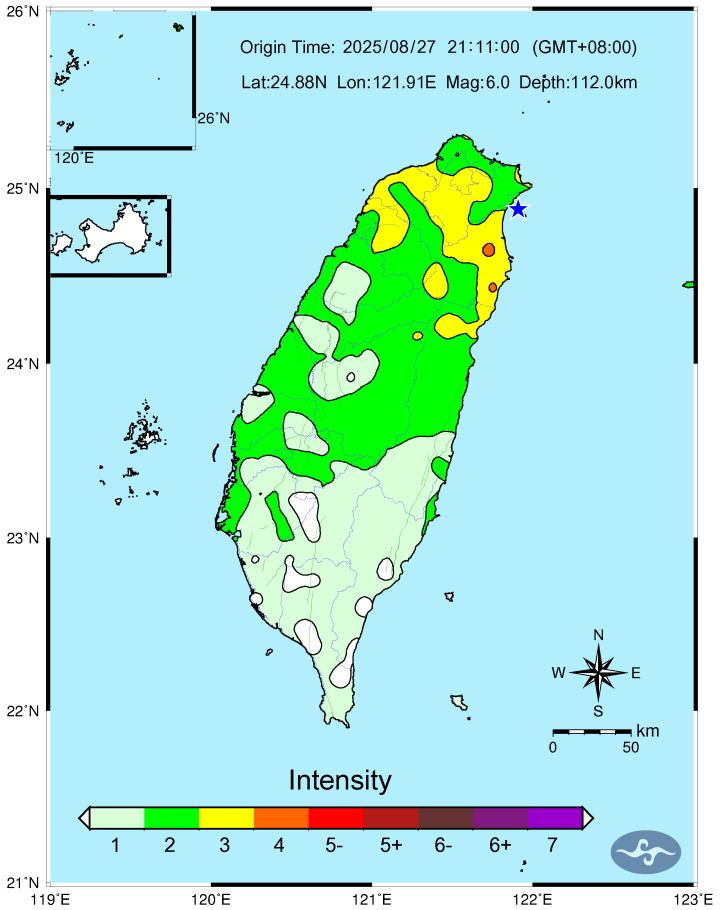
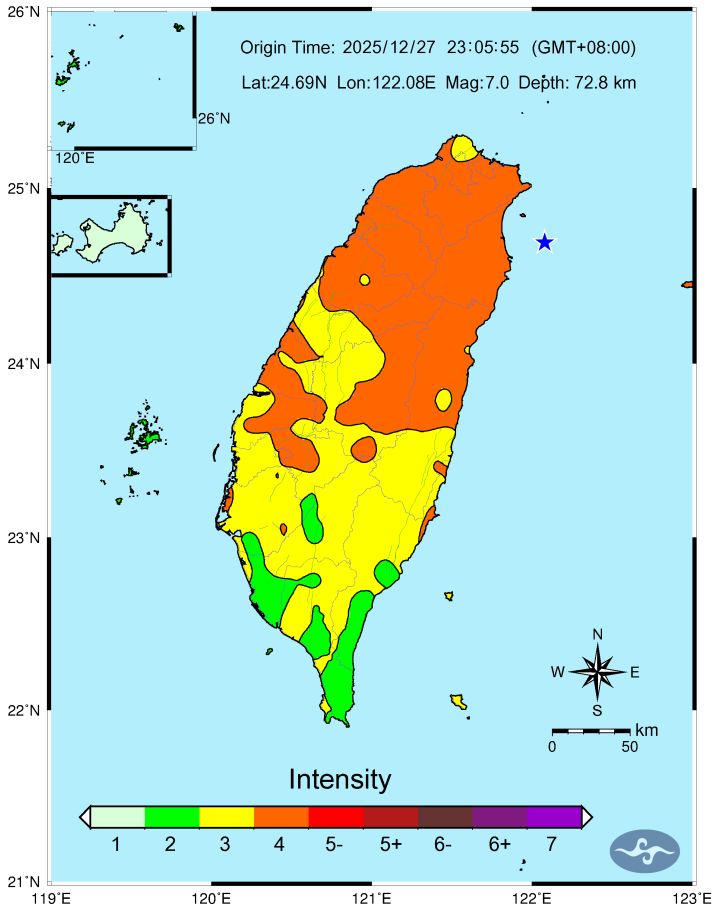
The following chronology lists temblors measuring 6 or higher on the Richter scale in the Taiwan area since WWII—quakes with lower intensity are shown only when human lives were lost. For temblors later than Jan. 1, 1995 the Central Weather Administration (CWA) under the MOTC provided image files with a map and intensity report in English, additional quake intensity maps for all temblors after Jan. 1, 2000 (courtesy © CWA); please click on the ℹ symbol to view. "Depth" refers to the focal depth in kilometers. Coordinates (longitude and latitude) as noted in the CWA reports. For offshore quakes, the distances from the epicenter to the closest location on Taiwan proper were determined by the chief researcher with Google Earth, minor inaccuracies cannot be ruled out.
TABLE 1—List of major earthquakes in the Taiwan area since WWII (general overview)
| Year | Date | Magnitude | Depth | Fatalities | Location of epicenter | Coordinates |
|---|---|---|---|---|---|---|
| 1946 | Dec. 5 | 6.1 | 5 km | 74 | Xinshi 744 (Tainan County) ℹ | 120.33° E, 23.07° N |
| 1951 | Oct. 22 | 7.1 | 1 km | 68 | ~ 8.2 km off Xincheng 971 (Hualien County) ℹ ℹ | 121.72° E, 24.08° N |
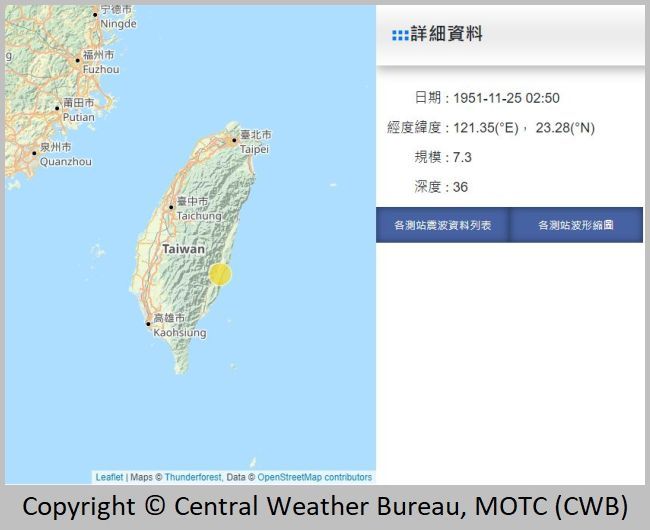
| Nov. 25 | 7.3 | 36 km | 17 | Fuli 983 (Hualien County) ℹ | 121.35° E, 23.28° N | |
| 1955 | April 4 | 6.5 | 5 km | — | ~ 11.5 km off Hengchun 946 (Pingtung County) ℹ | 120.9° E, 21.8° N |
| 1957 | Feb. 24 | 7.1 | 30 km | 11 | ~ 21.6 km off Shoufeng 974 (Hualien County) ℹ | 121.8° E, 23.8° N |
| Oct. 20 | 6.4 | 10 km | 4 | Guangfu 976 (Hualien County) ℹ | 121.5° E, 23.7° N | |
| 1959 | April 27 | 7.5 | 150 km | 1 | ~ 49.9 km off Gongliao 228 (Taipei County) ℹ | 122.5° E, 25° N |
| Aug. 15 | 7.1 | 20 km | 16 | ~ 50.1 km off Hengchun 946 (Pingtung County) ℹ | 121.3° E, 21.7° N | |
| 1963 | Feb. 13 | 7.4 | 47 km | 3 | ~ 25.8 km off Su'ao 270 (Yilan County) ℹ | 122.1° E, 24.4° N |
| March 4 | 5.9 | 5 km | 1 | Su'ao 270 (Yilan County) ℹ | 121.8° E, 24.6° N | |
| 1964 | Jan. 18 | 6.3 | 18 km | 106 | Nanhua 716 (Tainan County) ℹ | 120.6° E, 23.2° N |
| 1965 | May 18 | 6.1 | 21 km | — | ~ 30.2 km off Taitung City 950 (Taitung County) ℹ | 121.3° E, 22.5° N |
| 1966 | March 13 | 7.8 | 42 km | 4 | ~ 86.3 km off Su'ao 270 (Yilan County), near Hualien ℹ | 122.67° E, 24.24° N |
| 1967 | Oct. 25 | 5.9 | 65 km | 2 | ~ 33.3 km off Su'ao 270 (Yilan County) ℹ | 122.2° E, 24.5° N |
| 1972 | Jan. 25 | 7.5 | 33 km | 1 | ~ 114.0 km off Chenggong 961 (Taitung County) ℹ ℹ | 122.26° E, 22.46° N |
| April 24 | 6.7 | 15.4 km | 5 | ~ 2.7 km off Fengbin 977 (Hualien County) ℹ | 121.53° E, 23.51° N | |
| 1978 | Dec. 23 | 7.0 | 4.12 km | 2 | ~ 53.7 km off Changbin 962 (Taitung County), near Hualien ℹ | 122.00° E, 23.3° N |
| 1982 | Jan. 23 | 5.8 | 3.25 km | 1 | ~ 2.6 km off Shoufeng 974 (Hualien County) ℹ | 121.63° E, 23.91° N |
| 1986 | May 20 | 6.5 | 15.82 km | 1 | Xiulin 972 (Hualien County) ℹ | 121.59° E, 24.08° N |
| Nov. 15 | 6.8 | 15 km | 13 | ~ 18.7 km off Hualien City 970 (Hualien County) ℹ | 121.83° E, 23.99° N | |
| 1990 | Dec. 13 | 6.5 | 2.82 km | 2 | Shoufeng 974 (Hualien County) ℹ | 121.55° E, 23.88° N |
| 1994 | June 5 | 6.5 | 5.3 km | 1 | ~ 1.2 km off Su'ao 270 (Yilan County) ℹ | 121.84° E, 24.46° N |
| 1995 | Feb. 23 | 5.8 | 21.7 km | 2 | ~ 1.5 km off Xiulin 972 (Hualien County) ℹ | 121.69° E, 24.20° N |
| June 25 | 6.5 | 39.9 km | 1 | Datong 267 (Yilan County) ℹ | 121.67° E, 24.61° N | |
| 1996 | Sept. 6 | 7.1 | 14.8 km | — | ~ 15.5 km off Lanyu 952 (Taitung County)* ℹ | 121.37° E, 22.00° N |
| 1998 | July 17 | 6.2 | 2.8 km | 5 | Zhuqi 604 (Chiayi County) ℹ | 120.66° E, 23.50° N |
| 1999 | Sept. 21 | 7.3 | 8.0 km | 2,415 | Jiji 552 (Nantou County) ℹ ℹ | 120.82° E, 23.85° N |
| Sept. 26 | 6.8 | 12.1 km | 7 | Ren'ai 546 (Nantou County) ℹ | 121.00° E, 23.85° N | |
| Oct. 22 | 6.4 | 16.6 km | — | Minxiong 621 (Chiayi County) ℹ | 120.42° E, 23.52° N | |
| 2000 | May 17 | 5.6 | 9.7 km | 3 | Ren'ai 546 (Nantou County) ℹ ℹ | 121.10° E, 24.19° N |
| June 11 | 6.7 | 16.2 km | 2 | Ren'ai 546 (Nantou County) ℹ ℹ | 121.11° E, 23.90° N | |
| 2002 | March 31 | 6.8 | 13.8 km | 5 | ~ 46.4 km off Xiulin 972 (Hualien County) ℹ ℹ | 122.19° E, 24.14° N |
| May 15 | 6.2 | 8.5 km | 1 | ~ 2.7 km off Su'ao 270 (Yilan County) ℹ ℹ | 121.87° E, 24.65° N | |
| 2003 | Dec. 10 | 6.4 | 17.7 km | — | ~ 3.5 km off Chenggong 961 (Taitung County) ℹ ℹ | 121.40° E, 23.07° N |
| 2004 | May 1 | 5.3 | 21.6 km | 2 | Xiulin 972 (Hualien County) ℹ ℹ | 121.53° E, 24.08° N |
| 2006 | April 1 | 6.2 | 7.2 km | — | Yanping 953 (Taitung County) ℹ ℹ | 121.08° E, 22.88° N |
| Dec. 26 | 7.0 | 44.1 km | 2 | ~ 30.7 km off Hengchun 946 (Pingtung County) ℹ ℹ | 120.56° E, 21.69° N | |
| " | 7.0 | 50.2 km | — | ~ 28.2 km off Hengchun 946 (Pingtung County) ℹ ℹ | 120.42° E, 21.97° N | |
| 2009 | Nov. 5 | 6.2 | 24.1 km | — | Zhushan 557 (Nantou County) ℹ ℹ | 120.72° E, 23.79° N |
| Dec. 19 | 6.9 | 43.8 km | 1 | ~ 8.6 km off Shoufeng 974 (Hualien County) ℹ ℹ | 121.66° E, 23.79° N | |
| 2010 | March 4 | 6.4 | 22.6 km | — | Maolin 851 (Kaohsiung County) ℹ ℹ | 120.71° E, 22.97° N |
| 2012 | Feb. 26 | 6.4 | 26.3 km | — | Wutai 902 (Pingtung County) ℹ ℹ | 120.75° E, 22.75° N |
| 2013 | March 27 | 6.2 | 19.4 km | 1 | Ren'ai 546 (Nantou County) ℹ ℹ | 121.05° E, 23.90° N |
| June 2 | 6.5 | 14.5 km | 4 | Yuchi 555 (Nantou County) ℹ ℹ | 120.97° E, 23.86° N | |
| Oct. 31 | 6.4 | 15.0 km | — | Ruisui 978 (Hualien County) ℹ ℹ | 121.35° E, 23.57° N | |
| 2015 | Feb. 14 | 6.3 | 27.8 km | — | ~ 6.8 km off Lyudao 951 (Taitung County)* ℹ ℹ | 121.40° E, 22.66° N |
| April 20 | 6.4 | 30.6 km | 1 | ~ 75.1 km off Xiulin 972 (Hualien County) ℹ ℹ | 122.44° E, 24.02° N | |
| 2016 | Feb. 6 | 6.6 | 14.6 km | 117 | Meinong 843 (Kaohsiung City) ℹ ℹ ℹ | 120.54° E, 22.92° N |
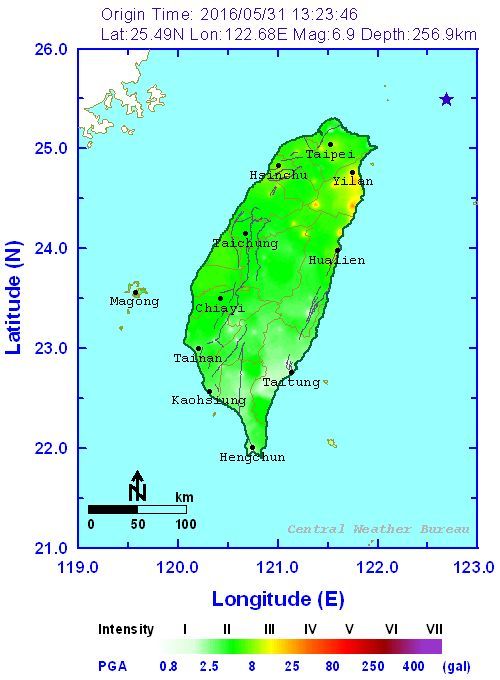
| May 31 | 6.9 | 256.9 km | — | ~ 86.1 km off Ruifang 224 / Gongliao 228 (New Taipei City) ℹ ℹ | 122.68° E, 25.49° N | |
| Oct. 6 | 6.2 | 23.7 km | — | ~ 13.7 km off Lyudao 951 (Taitung County)* ℹ ℹ | 121.34° E, 22.63° N | |
| 2018 | Feb. 6 | 6.2 | 6.3 km | 17 | ~ 8.0 km off Xincheng 971 (Hualien County) ℹ ℹ ℹ | 121.73° E, 24.10° N |
| 2019 | April 18 | 6.3 | 20.3 km | — | Xiulin 972 (Hualien County) ℹ ℹ | 121.56° E, 24.05° N |
| Aug. 8 | 6.2 | 24.2 km | 1 | ~ 6.7 km off Su'ao 270 (Yilan County) ℹ ℹ | 121.91° E, 24.44° N | |
| 2020 | Dec. 10 | 6.6 | 75.7 km | — | ~ 11.3 km off Guishan Island 261 (Yilan County)* ℹ ℹ | 122.00° E, 24.74° N |
| 2021 | April 18 | 6.2 | 14.4 km | — | Shoufeng 974 (Hualien County) ℹ ℹ | 121.48° E, 23.86° N |
| Oct. 24 | 6.5 | 65.6 km | — | Nan'ao 272 (Yilan County) ℹ ℹ | 121.78° E, 24.53° N | |
| 2022 | Jan. 3 | 6.0 | 19.4 km | — | ~ 51.9 km off Xiulin 972 (Hualien County) ℹ ℹ | 122.18° E, 24.02° N |
| March 23 | 6.7 | 25.7 km | — | ~ 12.3 km off Fengbin 977 (Hualien County) / Changbin 962 (Taitung County) ℹ ℹ | 121.61° E, 23.40° N | |
| June 20 | 6.0 | 6.8 km | — | Guangfu 976 (Hualien County) ℹ ℹ | 121.47° E, 23.68° N | |
| Sept. 17 | 6.4 | 7.3 km | — | Haiduan 957 (Taitung County) ℹ ℹ | 121.16° E, 23.08° N | |
| Sept. 18 | 6.1 | 12.1 km | — | Haiduan 957 (Taitung County) ℹ ℹ | 121.18° E, 23.13° N | |
| " | 6.8 | 7.0 km | 1 | Chishang 958 (Taitung County) ℹ ℹ | 121.20° E, 23.14° N | |
| Sept. 19 | 6.0 | 13.4 km | — | Zhuoxi 982 (Hualien County) ℹ ℹ | 121.30° E, 23.44° N | |
| Dec. 15 | 6.2 | 5.7 km | — | ~ 20.8 km off Shoufeng 974 (Hualien County) ℹ ℹ | 121.78° E, 23.77° N | |
| 2024 | April 3 | 7.2 | 15.5 km | 18 | ~ 10.2 km off Shoufeng 974 (Hualien County) ℹ ℹ | 121.67° E, 23.77° N |
| April 23 | 6.3 | 5.5 km | — | Shoufeng 974 (Hualien County) ℹ ℹ | 121.54° E, 23.85° N | |
| April 27 | 6.1 | 24.9 km | — | ~ 1.6 km off Xiulin 972 (Hualien County) ℹ ℹ | 121.68° E, 24.19° N | |
| Aug. 16 | 6.3 | 9.7 km | — | ~ 25.4 km off Shoufeng 974 (Hualien County) ℹ ℹ | 121.82° E, 23.74° N | |
| 2025 | Jan. 21 | 6.4 | 9.7 km | — | Dapu 607 (Chiayi County) ℹ ℹ | 120.57° E, 23.23° N |
| June 11 | 6.4 | 30.9 km | — | ~ 20.6 km off Changbin 962 (Taitung County) ℹ ℹ | 121.68° E, 23.36° N | |
| Aug. 27 | 6.0 | 112.0 km | — | ~ 5.1 km off Guishan Island 261 (Yilan County)* ℹ ℹ | 121.91° E, 24.88° N | |
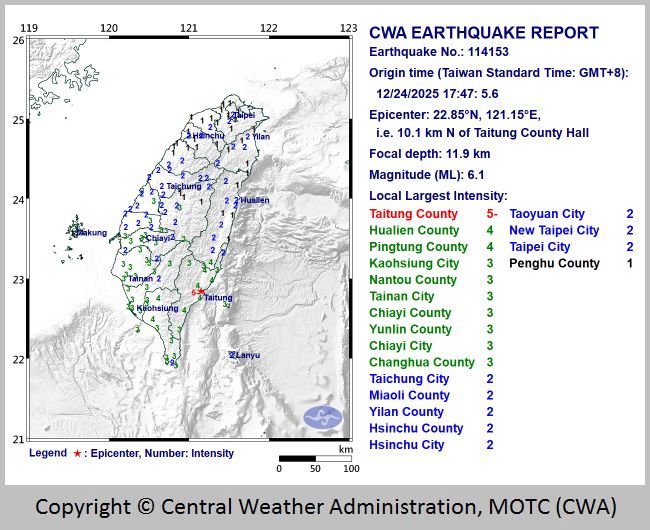
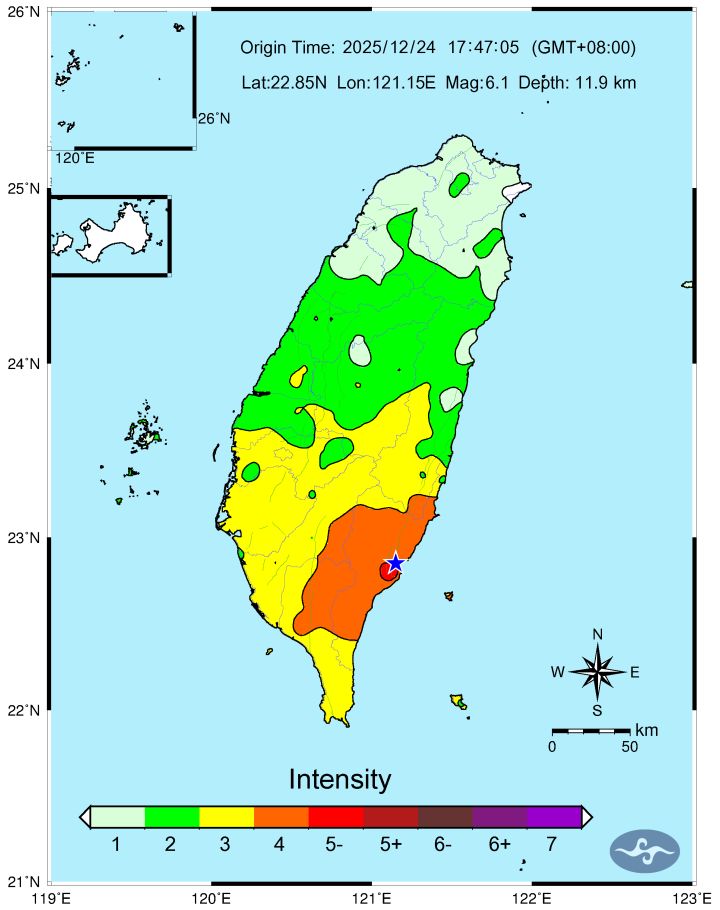
| Dec. 24 | 6.1 | 11.9 km | — | Beinan 954 (Taitung County) ℹ ℹ | 121.15° E, 22.85° N | |
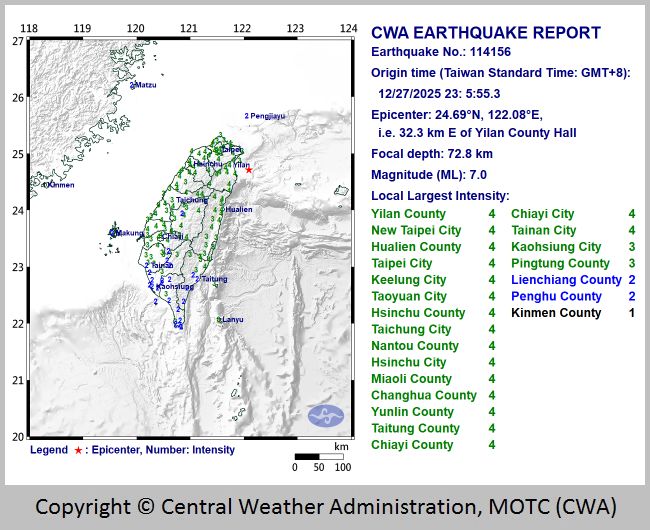
| Dec. 27 | 7.0 | 72.8 km | — | ~ 20.1 km off Guishan Island 261 (Yilan County)* ℹ ℹ | 122.08° E, 24.69° N | |
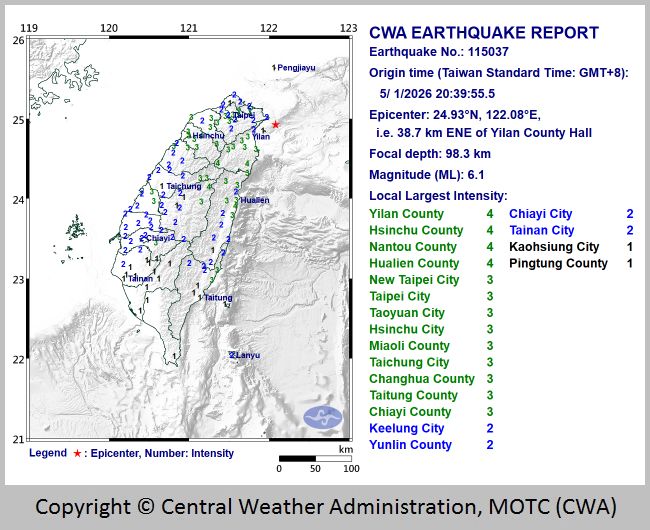
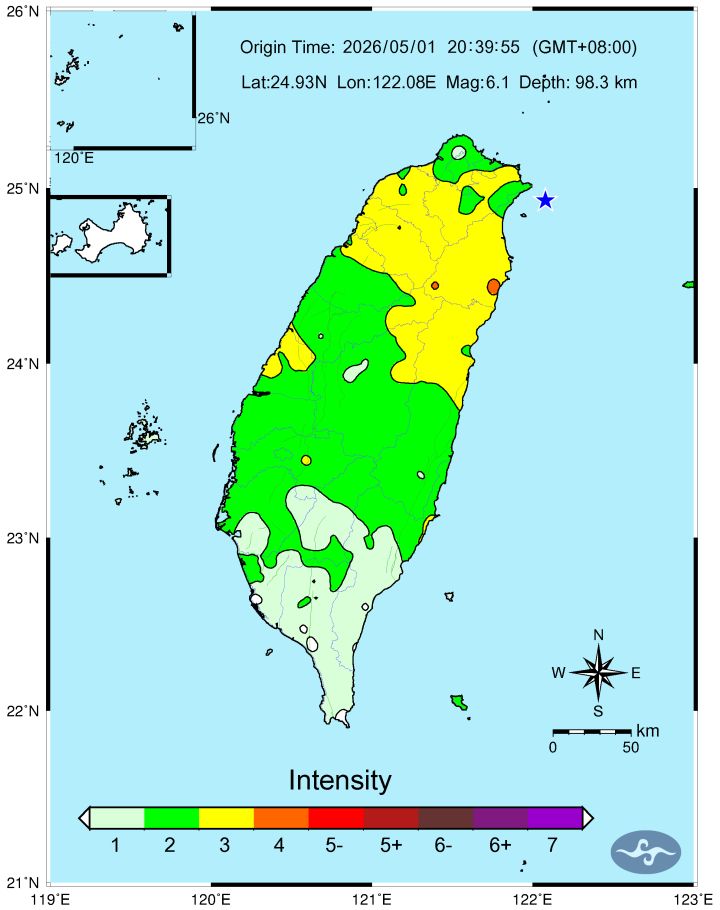
| 2026 | May 1 | 6.1 | 98.3 km | — | ~ 11.3 km off Gongliao 228 (New Taipei City) ℹ ℹ | 122.08° E, 24.93° N |
TOP HOME [◆ Geography/climate] [Geology] [Earthquakes]
TABLE 2—Offshore earthquakes close to smaller islands near Taiwan proper
Some offshore earthquakes were close to smaller islands off Taiwan's east coast (Taitung county's Lanyu and Lyudao, Yilan county's Guishan Island). The table below shows the respective distances from the epicenter to the island in question and to the closest location on Taiwan proper.
| Year | Date | Coordinates | Offshore island | Distance | Closest location on Taiwan proper | Distance |
|---|---|---|---|---|---|---|
| 1996 | Sept. 6 | 121.37° E, 22.00° N | Lanyu 952 | ~ 15.5 km | Manzhou 947 (Pingtung County) | ~ 48.8 km |
| 2015 | Feb. 14 | 121.40° E, 22.66° N | Lyudao 951 | ~ 6.8 km | Taitung City 950 (Taitung County) | ~ 25.6 km |
| 2016 | Oct. 6 | 121.34° E, 22.63° N | " | ~ 13.7 km | Taitung City 950 (Taitung County) | ~ 22.3 km |
| 2020 | Dec. 10 | 122.00° E, 24.74° N | Guishan Island 261 | ~ 11.3 km | Zhuangwei 263 / Wujie 268 (Yilan County) | ~ 17.2 km |
| 2025 | Aug. 27 | 121.91° E, 24.88° N | " | ~ 5.1 km | Toucheng 261 (Yilan County) | ~ 4.8 km |
| Dec. 27 | 122.08° E, 24.69° N | " | ~ 20.1 km | Su'ao 270 (Yilan County) | ~ 22.3 km |
Notes
The magnitudes of the quakes in the first of the two tables above are listed according to the figures provided by the CWA which
in some cases might differ from information offered by other sources like the United
States Geological Survey (USGS) or the China Earthquake Networks Center (Zhongguo dizhen taiwang zhongxin
中國地震台網中心, abbrev. CENC) under the PRC's China Earthquake Administration (Zhongguo dizhenju 中國地震局,
abbrev. CEA). For example, the 921 Earthquake on Sept. 21, 1999 had a magnitude of 7.3 according to CWA, but
the USGS reported that temblor having a magnitude of 7.7; the USGS also gave the date as Sept. 20, 1999 due to the time difference—that particular quake hit Nantou County
early in the morning at 1:47 a.m. local time, which was at noon 12:47 EST
the previous day at the USGS HQ in Reston (Virginia), or 17:47 UTC. Meanwhile, the PRC's CEA assessed the magnitude
of the 921 temblor at 7.6.
As the data in Table 1 clearly indicate, the seismically most active region in the Taiwan area is the island's east coast (Hualien County, Taitung County, and Yilan County)—since WWII, more than two thirds of all strong temblors struck there. While higher-intensity quakes can affect places anywhere on Taiwan proper, the ROC's three offshore counties (Penghu, Kinmen, and Lienchiang/Matsu) have a much lower risk of seismic activity. In this context, an interesting map created by Hsu Shih-hung 許世弘 ("Hsu.shihhung") and placed on Chinese Wikipedia showing Taiwan's seismicity can be found here.
115 of the 117 fatalities in the 2016 Meinong temblor occurred when the residential complex Wei Guan Golden Dragon Building (weiguan jinlong dalou 維冠金龍大樓) in Tainan City's Yongkang District toppled to one side. According to media reports, an investigation showed that the construction process had included the use of cooking-oil cans and polystyrene materials inside the 17-story building's walls and pillars. The chairman of the development company, its design manager, two architects and a construction technician were later found responsible for the disaster and convicted.
A ban on the construction of buildings over four stories was lifted by the Executive Yuan on Nov. 14, 1974 (China Yearbook 1976, p. 488).
TOP HOME [◆ Geography/climate] [Geology] [Earthquakes]
TABLE 3—All temblors above magnitude 7 (in chronological order)
| Year | Date | Magnitude | Depth | Fatalities | Location of epicenter |
|---|---|---|---|---|---|
| 1951 | Oct. 22 | 7.1 | 1 km | 68 | ~ 8.2 km off Xincheng 971 (Hualien County) |
| Nov. 25 | 7.3 | 36 km | 17 | Fuli 983 (Hualien County) | |
| 1957 | Feb. 24 | 7.1 | 30 km | 11 | ~ 21.6 km off Shoufeng 974 (Hualien County) |
| 1959 | April 27 | 7.5 | 150 km | 1 | ~ 49.9 km off Gongliao 228 (Taipei County) |
| Aug. 15 | 7.1 | 20 km | 16 | ~ 50.1 km off Hengchun 946 (Pingtung County) | |
| 1963 | Feb. 13 | 7.4 | 47 km | 3 | ~ 25.8 km off Su'ao 270 (Yilan County) |
| 1966 | March 13 | 7.8 | 42 km | 4 | ~ 86.3 km off Su'ao 270 (Yilan County), near Hualien |
| 1972 | Jan. 25 | 7.5 | 33 km | 1 | ~ 114.0 km off Chenggong 961 (Taitung County) |
| 1978 | Dec. 23 | 7.0 | 4.12 km | 2 | ~ 53.7 km off Changbin 962 (Taitung County), near Hualien |
| 1996 | Sept. 6 | 7.1 | 14.8 km | — | ~ 15.5 km off Lanyu 952 (Taitung County) |
| 1999 | Sept. 21 | 7.3 | 8.0 km | 2,415 | Jiji 552 (Nantou County) |
| 2006 | Dec. 26 | 7.0 | 44.1 km | 2 | ~ 30.7 km off Hengchun 946 (Pingtung County) |
| Dec. 26 | 7.0 | 50.2 km | — | ~ 28.2 km off Hengchun 946 (Pingtung County) | |
| 2024 | April 3 | 7.2 | 15.5 km | 18 | ~ 10.2 km off Shoufeng 974 (Hualien County) |
| 2025 | Dec. 27 | 7.0 | 72.8 km | — | ~ 20.1 km off Guishan Island 261 (Yilan County) |
TOP HOME [◆ Geography/climate] [Geology] [Earthquakes]
TABLE 4—Taiwan's deadliest earthquakes (2 or more fatalities) since WWII
| Fatalities | Year, date | Magnitude | Depth | Location of epicenter |
|---|---|---|---|---|
| 2,415 | 1999, Sept. 21 | 7.3 | 8.0 km | Jiji 552 (Nantou County) |
| 117 | 2016, Feb. 6 | 6.6 | 14.6 km | Meinong 843 (Kaohsiung City) |
| 106 | 1964, Jan. 18 | 6.3 | 18 km | Nanhua 716 (Tainan County) |
| 74 | 1946, Dec. 5 | 6.1 | 5 km | Xinshi 744 (Tainan County) |
| 68 | 1951, Oct. 22 | 7.1 | 1 km | ~ 8.2 km off Xincheng 971 (Hualien County) |
| 18 | 2024, April 3 | 7.2 | 15.5 km | ~ 10.2 km off Shoufeng 974 (Hualien County) |
| 17 | 1951, Nov. 25 | 7.3 | 36 km | Fuli 983 (Hualien County) |
| 17 | 2018, Feb. 6 | 6.2 | 6.3 km | ~ 8.0 km off Xincheng 971 (Hualien County) |
| 16 | 1959, Aug. 15 | 7.1 | 20 km | ~ 50.1 km off Hengchun 946 (Pingtung County) |
| 13 | 1986, Nov. 15 | 6.8 | 15 km | ~ 18.7 km off Hualien City 970 (Hualien County) |
| 11 | 1957, Feb. 24 | 7.1 | 30 km | ~ 21.6 km off Shoufeng 974 (Hualien County) |
| 7 | 1999, Sept. 26 | 6.8 | 12.1 km | Ren'ai 546 (Nantou County) |
| 5 | 1972, April 24 | 6.7 | 15.4 km | ~ 2.7 km off Fengbin 977 (Hualien County) |
| 5 | 1998, July 17 | 6.2 | 2.8 km | Zhuqi 604 (Chiayi County) |
| 5 | 2002, March 31 | 6.8 | 13.8 km | ~ 46.4 km off Xiulin 972 (Hualien County) |
| 4 | 1957, Oct. 20 | 6.4 | 10 km | Guangfu 976 (Hualien County) |
| 4 | 1966, March 13 | 7.8 | 42 km | ~ 86.3 km off Su'ao 270 (Yilan County), near Hualien |
| 4 | 2013, June 2 | 6.5 | 14.5 km | Yuchi 555 (Nantou County) |
| 3 | 1963, Feb. 13 | 7.4 | 47 km | ~ 25.8 km off Su'ao 270 (Yilan County) |
| 3 | 2000, May 17 | 5.6 | 9.7 km | Ren'ai 546 (Nantou County) |
| 2 | 1967, Oct. 25 | 5.9 | 65 km | ~ 33.3 km off Su'ao 270 (Yilan County) |
| 2 | 1978, Dec. 23 | 7.0 | 4.12 km | ~ 53.7 km off Changbin 962 (Taitung County), near Hualien |
| 2 | 1990, Dec. 13 | 6.5 | 2.82 km | Shoufeng 974 (Hualien County) |
| 2 | 1995, Feb. 23 | 5.8 | 21.7 km | ~ 1.5 km off Xiulin 972 (Hualien County) |
| 2 | 2000, June 11 | 6.7 | 16.2 km | Ren'ai 546 (Nantou County) |
| 2 | 2004, May 1 | 5.3 | 21.6 km | Xiulin 972 (Hualien County) |
| 2 | 2006, Dec. 26 | 7.0 | 44.1 km | ~ 30.7 km off Hengchun 946 (Pingtung County) |
Please note that the fatalities of the 921 Earthquake on Sept. 21, 1999 were not confined to locations around the epicenter in Nantou County. The temblor caused widespread damage in many places, with the majority of deaths in central Taiwan, but dozens perished in collapsed or toppled buildings in Taipei City and County as well.
TOP HOME [◆ Geography/climate] [Geology] [Earthquakes]
TABLE 5—Taiwan's seismic hotspots
In Table 1, the ranking of Taiwan's cities, counties and special municipalities in terms of earthquake occurance since WWII is as follows.
| City / county | Quakes | City / county | Quakes | City / county | Quakes | ||
|---|---|---|---|---|---|---|---|
| Hualien County | Nantou County | New Taipei City | |||||
| Taitung County | Pingtung County | Kaohsiung City | |||||
| Yilan County | Chiayi County | Tainan City |
Above list shows that since WWII no major earthquakes with magnitude 6 or higher were recorded having their epicenter in the following local administrations—Taipei City, Taoyuan City, Taichung City; Hsinchu County, Miaoli County, Changhua County, Yunlin County; Keelung City, Hsinchu City, and Chiayi City. However, temblors with a lesser magnitude can occur anywhere on the island, and strong quakes can be felt in all parts of Taiwan proper, so the entire island can be considered earthquake-prone. Generally speaking, the offshore islands belonging to Penghu County, Kinmen County, and Lienchiang County are not regarded as seismic hotspots.
For example, the shockwaves of the catastrophic 921 Earthquake on Sept. 21, 1999 affected every city and county of Taiwan proper with an intensity of at least 3 or higher and even reached Penghu County with an intensity of 4.
The deadliest earthquake in the Taiwan area during the Japanese colonial period (1895-1945) struck on April 21, 1935 in Sanyi 三義 (today's Miaoli County) with a magnitude of 7.1 and claimed 3,276 lives. For a list of major temblors in Taiwan during that period click here.
TOP HOME [◆ Geography/climate] [Geology] [Earthquakes]
TABLE 6—Milestones of seismology in Taiwan
The following chronology outlines the development of earthquake observation in Taiwan, source: Sin Mei Ng, Jacques Angelier, Chung-Pai Chang—"Earthquake cycle in Western Taiwan: Insights from historical seismicity" (published on Aug. 1, 2009 in: Geophysical Journal International, Volume 178, Issue 2, August 2009, pages 753–774).
| Year / period | Event |
|---|---|
| 1897 | Installation of the first Gray-Milne Seismograph (Gelei - Mi'ernexing dizhenyi 格雷-米爾恩型地震儀) in Taipei, official beginning of instrumental seismic observation in Taiwan |
| 1928 | Seismometers of Wiechert type (Weixiashi dizhenyi 威赫式地震儀), with Omori Horizontal Seismographs (Dasenshi shuiping dizhenyi 大森式水平地震儀) and Strong-motion Seismographs (qiangzhenyi 強震儀), are installed in Taipei, Tainan, Penghu, Hualien, Alishan, Taitung, Hengchun, Kaohsiung and Taichung |
| 1935 | After the Miaoli and Taichung earthquakes, the number of stations increased with the addition of Hsinchu, Ilan, Dawu and Chengkung stations |
| 3/1945—1/1946 | Seismic observation nearly ceased, with seismometers getting obsolete or damaged |
| 1951 | After the occurrence of large earthquakes in 1951 in eastern Taiwan, new strong motion seismometers and Acceleration Seismographs (jiasudu dizhenyi 加速度地震儀) are added |
| 1963 | A World-Wide Standardized Seismograph Network (shijie biaozhun dizhen guancewang 世界標準地震觀測網, abbrev. WWSSN) station is installed at Anpu, Taipei |
| 1973 | The Taiwan Telemetered Seismographic Network (Taiwan yaojishi dizhen guancewang 臺灣遙計式地震觀測網, abbrev. TTSN) starts operating |
| 1989 | The Seismological Centre of CWB (zhongyang qixiangju dizhen cebao zhongxin 中央氣象局地震測報中心) is established on July 1 |
| 1992 | The Institute of Earth Sciences, Academia Sinica (zhongyang yanjiuyuan diqiu kexue yanjiusuo 中央研究院地球科學研究所, abbrev. IES) starts preparing the establishment of the Broadband Array in Taiwan for Seismology (Taiwan kuanpin dizhen guancewang 台灣寬頻地震觀測網, abbrev. BATS) |
TOP HOME [◆ Geography/climate] [Geology] [Earthquakes]
Hot springs ♨
 The most famous
spots with hot springs in Taiwan are located in Beitou 北投 (Taipei City) and the Yangmingshan 陽明山 area
(Taipei City/New Taipei City), Jinshan 金山, Wanli 萬里 and Wulai 烏來 (all in New Taipei City), Taian 泰安 (Miaoli
County), Jiaoxi 礁溪 (Yilan County), Dakeng 大坑 (Taichung City), Guguan 谷關 (Taichung City), Guanziling 關子嶺 (Tainan
City), Baolaibulao 寶來不老 (Kaohsiung City), Sichongxi 四重溪 (Pingtung County), Rueisuei 瑞穗 (Hualien County), Zhiben
知本 (Taitung County), and Green Island 綠島 (off Taitung County), to name just a few.
The most famous
spots with hot springs in Taiwan are located in Beitou 北投 (Taipei City) and the Yangmingshan 陽明山 area
(Taipei City/New Taipei City), Jinshan 金山, Wanli 萬里 and Wulai 烏來 (all in New Taipei City), Taian 泰安 (Miaoli
County), Jiaoxi 礁溪 (Yilan County), Dakeng 大坑 (Taichung City), Guguan 谷關 (Taichung City), Guanziling 關子嶺 (Tainan
City), Baolaibulao 寶來不老 (Kaohsiung City), Sichongxi 四重溪 (Pingtung County), Rueisuei 瑞穗 (Hualien County), Zhiben
知本 (Taitung County), and Green Island 綠島 (off Taitung County), to name just a few.
TOP HOME [◆ Geography/climate] [Geology]
Volcanism 🌋
Several islets/island groups close to Taiwan have volcanic origins: Penghu 澎湖, Green Island 綠島, Orchid Island 蘭嶼, the Three Northern Islands 北方三島 off Keelung and especially Guishan Island 龜山島 (aka Gueishan Island/Kueishan Island/Turtle Island). Noteworthy volcanic mountains on Taiwan proper include the Tatun Volcano Group 大屯火山群, the Keelung Volcano Group 基隆火山群, Guanyin Mountain 觀音山, and Caoling Mountain 草嶺山. On Oct. 17, 2011 the Taiwan Volcano Observatory – Tatun (Datun huoshan guancezhan 大屯火山觀測站, abbrev. TVO) was established at the Jingshan Nature Center (Jingshan ziran zhongxin 菁山自然中心) in Taipei's Yangmingshan National Park.
 Guishan Island, located 9.1 km off northeastern Taiwan's Yilan county, was long regarded the
only active volcano in the Taiwan area, representing the top of an andesite stratovolcano which rises from the seafloor
to an elevation of 401 m above sea level. According to scientists, at least four eruptions took place there in the past
7,000 years, the last one around 1785 A.D.
Guishan Island, located 9.1 km off northeastern Taiwan's Yilan county, was long regarded the
only active volcano in the Taiwan area, representing the top of an andesite stratovolcano which rises from the seafloor
to an elevation of 401 m above sea level. According to scientists, at least four eruptions took place there in the past
7,000 years, the last one around 1785 A.D.
There is some controversy in Taiwan whether the Tatun Volcano Group should be considered an active volcano or not. On Dec. 23, 2016 TVO Director Lin Cheng-horng 林正洪 published a scientific article reporting the existence of a volcanic magma chamber there, but according to comments from the Central Weather Bureau (CWB, i. e. the predecessor agency of the CWA) on Feb. 21, 2017 the finding does not mean that the volcanoes in the group are active. On May 29, 2019 TVO researchers announced that volcanic activity detected beneath the Tatun Volcano Group proved that Tatun was indeed an active volcano.
A team led by Lin subsequently also reported it found a volcanic conduit under Yangmingshan National Park, which according to the researchers could become a vent if any of the volcanoes in the north of the country erupted. The team found that a 2 km deep and 500 m wide volcanic vent had formed under the area of Dayoukeng 大油坑 of the Tatun Volcano Group, after nesting data collected through more than 1,000 seismic readings at the Tatun group from 2014 to 2017.
TOP HOME [◆ Geography/climate] [Geology]
Climate
Taiwan's climate is subtropical in the north and tropical in the south. The hot, humid summers last from May/June to October, coinciding with typhoon season; the winters are short and mild, snowfall in winter usually only on peaks above 3,000 m. The peculiar shape of the Lanyang Plain (rimmed by mountains in the south and west, open to the sea in the east) produces a climate with frequent rainfalls during the northeast monsoon in winter. Plum rain (meiyu 梅雨) season occurs between spring and summer.
Mean annual temperature: 22 ºC (January 15 ºC with 5º variation between north and south, July 27 ºC to 28 ºC). The island receives an average precipitation of ca. 2,500 mm annually—between 1981 and 2010 the city of Suao in Yilan County had an annual average of 4,439.8 mm, and in Huoshaoliao 火燒寮 (Dongshi Borough 東勢里, Pingxi District 平溪區, New Taipei City) it can even exceed 6,000 mm. The annual mean relative humidity averages ca. 60 to 90 percent.
Scientific reports indicate that the global climate change affects Taiwan as well. The Taiwan Climate Change Projection Information and Adaptation Knowledge Platform (Taiwan qihou bianqian tuigu zixun yu tiaoshi zhishi pingtai jihua 臺灣氣候變遷推估資訊與調適知識平台計畫, abbrev. TCCIP) aka "Taiwan Adaptation Platform" coordinated by the National Science and Technology Center for Disaster Reduction (NCDR) under the cabinet-level NSTC offers detailled information and data on that topic.
Climate data (1981-2010)
|
• Taipei City • Kaohsiung City • Taichung City |
• Hualien City • Jade Mountain/Yushan • Sun Moon Lake |
• Penghu • Lanyu/Orchid Island • Pengjia Island |
The following tables show climate data provided by selected weather stations operated by the Central Weather Administration (CWA), MOTC.
 Explanations:
①—mean maximum temperatures (unit: ºC);
②—mean temperatures (unit: ºC);
③—mean minimum temperatures (unit: ºC);
④—average precipitation (unit: mm);
⑤—mean relative humidity (unit: percent);
⑥—average number of days with precipitation ≥ 0.1 mm (unit: days);
⑦—sunshine duration (unit: hours).
Climate data Taipei City (1981-2010)
| Jan. | Feb. | March | April | May | June | July | Aug. | Sept. | Oct. | Nov. | Dec. | Total | |
|---|---|---|---|---|---|---|---|---|---|---|---|---|---|
| ① | 19.1 | 19.6 | 22.1 | 25.7 | 29.2 | 32.0 | 34.3 | 33.8 | 31.1 | 27.5 | 24.2 | 20.7 | Ø 26.6 |
| ② | 16.1 | 16.5 | 18.5 | 21.9 | 25.2 | 27.7 | 29.6 | 29.2 | 27.4 | 24.5 | 21.5 | 17.9 | Ø 23.0 |
| ③ | 13.9 | 14.2 | 15.8 | 19.0 | 22.3 | 24.6 | 26.3 | 26.1 | 24.8 | 22.3 | 19.3 | 15.6 | Ø 20.4 |
| ④ | 83.2 | 170.3 | 180.4 | 177.8 | 234.5 | 325.9 | 245.1 | 322.1 | 360.5 | 148.9 | 83.1 | 73.3 | 2,405.1 |
| ⑤ | 78.5 | 80.6 | 79.5 | 77.8 | 76.6 | 77.3 | 73.0 | 74.1 | 75.8 | 75.3 | 75.4 | 75.4 | Ø 76.6 |
| ⑥ | 14.1 | 14.6 | 15.5 | 14.9 | 14.8 | 15.5 | 12.3 | 14.0 | 13.8 | 11.9 | 12.4 | 11.7 | 165.5 |
| ⑦ | 80.6 | 71.3 | 89.6 | 92.6 | 113.7 | 121.7 | 179.0 | 188.9 | 153.7 | 124.0 | 99.4 | 90.7 | 1,405.2 |
Climate data Kaohsiung City (1981-2010)
| Jan. | Feb. | March | April | May | June | July | Aug. | Sept. | Oct. | Nov. | Dec. | Total | |
|---|---|---|---|---|---|---|---|---|---|---|---|---|---|
| ① | 23.9 | 24.7 | 26.8 | 29.1 | 30.8 | 31.6 | 32.4 | 31.9 | 31.4 | 30.0 | 27.7 | 24.9 | Ø 28.8 |
| ② | 19.3 | 20.3 | 22.6 | 25.4 | 27.5 | 28.5 | 29.2 | 28.7 | 28.1 | 26.7 | 24.0 | 20.6 | Ø 25.1 |
| ③ | 15.7 | 16.7 | 19.2 | 22.4 | 24.8 | 25.9 | 26.4 | 26.1 | 25.5 | 24.0 | 20.9 | 17.1 | Ø 22.1 |
| ④ | 16.0 | 20.5 | 38.8 | 69.8 | 197.4 | 415.3 | 390.9 | 416.7 | 241.9 | 42.7 | 18.7 | 16.2 | 1,884.9 |
| ⑤ | 72.7 | 73.5 | 73.2 | 75.1 | 76.9 | 80.1 | 78.7 | 80.5 | 78.9 | 75.5 | 73.3 | 71.9 | Ø 75.9 |
| ⑥ | 3.2 | 3.7 | 4.0 | 5.8 | 9.3 | 13.8 | 12.9 | 16.3 | 11.2 | 3.5 | 2.6 | 2.3 | 88.6 |
| ⑦ | 174.7 | 165.8 | 187.0 | 189.1 | 198.5 | 199.9 | 221.4 | 193.7 | 175.7 | 182.4 | 162.2 | 161.8 | 2,212.2 |
Climate data Taichung City (1981-2010)
| Jan. | Feb. | March | April | May | June | July | Aug. | Sept. | Oct. | Nov. | Dec. | Total | |
|---|---|---|---|---|---|---|---|---|---|---|---|---|---|
| ① | 22.0 | 22.4 | 24.6 | 27.6 | 30.2 | 31.9 | 33.0 | 32.6 | 31.8 | 30.1 | 27.0 | 23.6 | Ø 28.1 |
| ② | 16.6 | 17.3 | 19.6 | 23.1 | 26.0 | 27.6 | 28.6 | 28.3 | 27.4 | 25.2 | 21.9 | 18.1 | Ø 23.3 |
| ③ | 12.9 | 13.9 | 16.0 | 19.6 | 22.6 | 24.4 | 25.2 | 25.1 | 24.1 | 21.8 | 18.2 | 14.2 | Ø 19.8 |
| ④ | 30.3 | 89.8 | 103.0 | 145.4 | 231.5 | 331.2 | 307.9 | 302.0 | 164.5 | 23.2 | 18.3 | 25.9 | 1,773.0 |
| ⑤ | 74.6 | 76.8 | 76.6 | 77.3 | 77.1 | 77.9 | 75.6 | 77.6 | 75.8 | 72.6 | 72.7 | 72.3 | Ø 75.6 |
| ⑥ | 6.6 | 9.2 | 11.2 | 11.8 | 12.2 | 14.6 | 12.8 | 15.4 | 9.2 | 2.6 | 3.7 | 4.3 | 113.6 |
| ⑦ | 176.6 | 140.6 | 149.9 | 137.8 | 158.7 | 160.1 | 199.6 | 178.7 | 175.8 | 203.7 | 179.4 | 182.3 | 2,043.2 |
Climate data Hualien City (1981-2010)
| Jan. | Feb. | March | April | May | June | July | Aug. | Sept. | Oct. | Nov. | Dec. | Total | |
|---|---|---|---|---|---|---|---|---|---|---|---|---|---|
| ① | 21.1 | 21.5 | 23.4 | 26.0 | 28.5 | 30.4 | 32.0 | 32.0 | 30.4 | 28.2 | 25.4 | 22.5 | Ø 26.8 |
| ② | 18.0 | 18.4 | 20.2 | 22.7 | 25.1 | 27.1 | 28.5 | 28.2 | 26.8 | 24.8 | 22.2 | 19.3 | Ø 23.4 |
| ③ | 15.4 | 15.9 | 17.5 | 20.0 | 22.4 | 24.3 | 25.4 | 25.2 | 24.0 | 22.0 | 19.5 | 16.7 | Ø 20.7 |
| ④ | 62.2 | 94.2 | 85.9 | 87.0 | 195.4 | 221.7 | 205.2 | 242.0 | 399.2 | 362.7 | 152.1 | 69.2 | 2,176.8 |
| ⑤ | 76.0 | 78.3 | 78.8 | 79.6 | 80.3 | 81.2 | 77.9 | 78.2 | 79.2 | 76.2 | 74.8 | 73.2 | Ø 77.8 |
| ⑥ | 13.7 | 15.7 | 15.1 | 14.5 | 15.5 | 12.6 | 8.2 | 10.1 | 14.3 | 13.0 | 11.7 | 9.9 | 154.3 |
| ⑦ | 70.2 | 64.5 | 82.4 | 92.6 | 119.5 | 162.7 | 246.5 | 224.3 | 152.0 | 120.8 | 90.5 | 77.9 | 1,503.9 |
Climate data Jade Mountain/Yushan (1981-2010)
| Jan. | Feb. | March | April | May | June | July | Aug. | Sept. | Oct. | Nov. | Dec. | Total | |
|---|---|---|---|---|---|---|---|---|---|---|---|---|---|
| ① | 3.7 | 3.7 | 5.4 | 7.8 | 10.6 | 12.1 | 13.8 | 13.6 | 13.0 | 13.2 | 10.2 | 6.2 | Ø 9.4 |
| ② | -1.1 | -0.5 | 1.1 | 3.4 | 5.7 | 7.1 | 7.9 | 7.8 | 7.1 | 6.5 | 4.0 | 0.8 | Ø 4.2 |
| ③ | -4.5 | -3.7 | -1.9 | 0.4 | 2.6 | 4.2 | 4.4 | 4.4 | 3.8 | 2.6 | 0.3 | -2.7 | Ø 0.8 |
| ④ | 83.1 | 120.5 | 139.1 | 244.4 | 414.0 | 488.2 | 445.6 | 519.3 | 325.2 | 144.3 | 77.6 | 70.0 | 3,071.3 |
| ⑤ | 64.2 | 73.8 | 78.5 | 82.0 | 80.9 | 82.1 | 77.0 | 81.0 | 79.9 | 70.0 | 65.5 | 61.2 | Ø 74.7 |
| ⑥ | 7.2 | 7.1 | 8.6 | 14.6 | 18.5 | 18.6 | 17.2 | 18.4 | 16.0 | 11.0 | 7.7 | 5.6 | 150.5 |
| ⑦ | 202.4 | 146.8 | 150.0 | 132.1 | 139.7 | 132.5 | 177.2 | 160.4 | 152.3 | 207.2 | 203.9 | 203.5 | 2,008.0 |
Climate data Sun Moon Lake (1981-2010)
| Jan. | Feb. | March | April | May | June | July | Aug. | Sept. | Oct. | Nov. | Dec. | Total | |
|---|---|---|---|---|---|---|---|---|---|---|---|---|---|
| ① | 19.4 | 20.1 | 22.0 | 23.9 | 25.7 | 26.8 | 28.0 | 27.6 | 26.8 | 25.5 | 23.3 | 20.3 | Ø 24.1 |
| ② | 14.2 | 15.1 | 16.9 | 19.2 | 21.0 | 22.2 | 23.0 | 22.7 | 22.1 | 20.7 | 18.3 | 15.2 | Ø 19.2 |
| ③ | 11.1 | 12.0 | 13.8 | 16.4 | 18.3 | 19.6 | 20.1 | 20.0 | 19.4 | 17.9 | 15.3 | 12.2 | Ø 16.3 |
| ④ | 49.1 | 100.0 | 124.7 | 199.5 | 328.3 | 436.9 | 409.9 | 403.8 | 232.3 | 49.7 | 31.2 | 36.5 | 2,401.9 |
| ⑤ | 76.7 | 79.7 | 81.1 | 83.7 | 84.6 | 85.7 | 84.7 | 85.7 | 84.9 | 82.8 | 79.1 | 76.1 | Ø 82.1 |
| ⑥ | 8.3 | 9.6 | 12.2 | 14.5 | 18.0 | 21.2 | 18.8 | 19.9 | 14.6 | 6.2 | 5.6 | 6.0 | 154.9 |
| ⑦ | 162.2 | 131.5 | 125.7 | 104.2 | 115.1 | 113.7 | 155.4 | 135.3 | 122.7 | 148.2 | 162.8 | 169.2 | 1,646.0 |
Climate data Penghu (1981-2010)
| Jan. | Feb. | March | April | May | June | July | Aug. | Sept. | Oct. | Nov. | Dec. | Total | |
|---|---|---|---|---|---|---|---|---|---|---|---|---|---|
| ① | 19.3 | 19.6 | 22.4 | 26.0 | 28.8 | 30.6 | 32.0 | 31.8 | 30.7 | 28.1 | 24.8 | 21.1 | Ø 26.3 |
| ② | 16.9 | 17.1 | 19.5 | 23.0 | 25.7 | 27.6 | 28.7 | 28.6 | 27.8 | 25.4 | 22.4 | 18.9 | Ø 23.5 |
| ③ | 15.4 | 15.4 | 17.4 | 20.9 | 23.7 | 25.6 | 26.6 | 26.5 | 25.9 | 23.9 | 20.9 | 17.4 | Ø 21.6 |
| ④ | 17.5 | 50.7 | 59.5 | 88.3 | 118.3 | 153.9 | 157.7 | 181.0 | 112.7 | 28.4 | 21.2 | 24.2 | 1,013.4 |
| ⑤ | 79.7 | 82.2 | 82.1 | 82.7 | 83.6 | 85.9 | 84.8 | 85.0 | 80.9 | 76.8 | 77.3 | 77.4 | Ø 81.5 |
| ⑥ | 5.0 | 7.2 | 8.9 | 9.4 | 9.7 | 10.1 | 7.7 | 8.8 | 6.8 | 2.2 | 3.6 | 4.1 | 83.5 |
| ⑦ | 111.5 | 94.7 | 125.2 | 148.8 | 179.3 | 200.4 | 264.8 | 240.4 | 213.8 | 189.9 | 139.1 | 123.3 | 2,031.2 |
Climate data Lanyu/Orchid Island (1981-2010)
| Jan. | Feb. | March | April | May | June | July | Aug. | Sept. | Oct. | Nov. | Dec. | Total | |
|---|---|---|---|---|---|---|---|---|---|---|---|---|---|
| ① | 20.7 | 21.4 | 23.0 | 24.9 | 26.7 | 27.8 | 28.6 | 28.5 | 27.6 | 25.9 | 23.8 | 21.4 | Ø 25.0 |
| ② | 18.5 | 19.0 | 20.5 | 22.4 | 24.3 | 25.7 | 26.3 | 26.1 | 25.2 | 23.8 | 21.7 | 19.4 | Ø 22.7 |
| ③ | 17.0 | 17.4 | 18.8 | 20.8 | 22.7 | 24.1 | 24.6 | 24.3 | 23.5 | 22.3 | 20.3 | 17.9 | Ø 21.1 |
| ④ | 248.1 | 203.9 | 154.0 | 149.0 | 249.3 | 287.4 | 231.2 | 287.9 | 384.2 | 305.6 | 267.0 | 212.2 | 2,979.8 |
| ⑤ | 86.3 | 88.3 | 88.6 | 90.2 | 90.3 | 92.1 | 91.0 | 90.8 | 90.3 | 87.3 | 86.6 | 84.9 | Ø 88.9 |
| ⑥ | 22.2 | 19.0 | 16.7 | 15.1 | 15.7 | 15.3 | 14.2 | 16.6 | 19.5 | 19.6 | 20.5 | 21.0 | 215.4 |
| ⑦ | 80.8 | 78.8 | 106.0 | 113.0 | 136.5 | 140.8 | 196.2 | 171.6 | 143.7 | 134.1 | 94.7 | 77.6 | 1,473.8 |
Climate data Pengjia Island (1981-2010)
| Jan. | Feb. | March | April | May | June | July | Aug. | Sept. | Oct. | Nov. | Dec. | Total | |
|---|---|---|---|---|---|---|---|---|---|---|---|---|---|
| ① | 17.8 | 18.2 | 20.1 | 23.1 | 26.2 | 28.9 | 31.2 | 31.0 | 28.8 | 25.9 | 22.8 | 19.5 | Ø 24.5 |
| ② | 15.7 | 15.9 | 17.5 | 20.4 | 23.4 | 26.0 | 28.0 | 27.9 | 26.3 | 23.7 | 20.7 | 17.4 | Ø 21.9 |
| ③ | 13.7 | 13.9 | 15.3 | 18.2 | 21.3 | 24.0 | 25.8 | 25.8 | 24.5 | 22.1 | 19.0 | 15.5 | Ø 19.9 |
| ④ | 122.6 | 161.0 | 169.5 | 161.6 | 203.2 | 194.1 | 125.8 | 198.0 | 236.9 | 136.8 | 132.0 | 112.5 | 1,954.0 |
| ⑤ | 79.0 | 81.2 | 82.8 | 83.8 | 85.6 | 88.1 | 86.3 | 86.2 | 84.1 | 79.0 | 78.2 | 76.1 | Ø 82.5 |
| ⑥ | 17.1 | 17.0 | 18.5 | 14.6 | 14.3 | 12.1 | 6.6 | 9.6 | 12.1 | 11.5 | 14.3 | 14.0 | 161.7 |
| ⑦ | 63.1 | 56.0 | 80.8 | 98.1 | 138.2 | 161.4 | 259.6 | 250.0 | 191.3 | 147.5 | 93.0 | 65.9 | 1,604.9 |
The following table shows the respective highest and lowest figures (annual average 1981-2010) measured by CWA's weather stations in the Taiwan area.
| Highest | Weather station(s) | Lowest | Weather station | |
|---|---|---|---|---|
| ① | 28.8 ºC | Hengchun; Tainan | 9.4 ºC | Yushan |
| ② | 25.1 ºC | Hengchun; Kaohsiung | 4.2 ºC | Yushan |
| ③ | 22.5 ºC | Hengchun | 0.8 ºC | Yushan |
| ④ | 4,863.1 mm | Anbu | 1,013.4 mm | Penghu |
| ⑤ | 89.7 % | Anbu | 74.1 % | Taitung |
| ⑥ | 215.4 days | Lanyu | 67.5 days | Dongjidao |
| ⑦ | 2,233.8 hours | Hengchun | 935.0 hours | Anbu |
Peak minimum/maximum temperatures according to Chinese Wikipedia 維基百科: Taipei –0.2 ºC (February) and 39.3 ºC (August), Kaohsiung 4.4 ºC (December) and 37.2 ºC (June).
TOP HOME [◆ Geography/climate] [Climate]
Weather warnings
The duties of the CWA include issuing warnings to the population against dangerous weather conditions, e. g. heat information (gaowen zixun 高溫資訊), cold surge advisory (diwen tebao 低溫特報), extremely heavy rain advisory (haoyu tebao 豪雨特報), dense fog advisory (nongwu tebao 濃霧特報), strong wind advisory (lushang qiangfeng tebao 陸上強風特報) and especially typhoon warnings (taifeng jingbao 颱風警報). The CWA issues its warnings in accordance to certain standards.
In summer, the CWA may issue colour-coded heat warnings according to specific criteria: yellow signal (huangse denghao 黃色燈號), orange signal (chengse denghao 橙色燈號), and red signal (hongse denghao 紅色燈號).
| Signal | Heat information criteria |
|---|---|
| Yellow | Daily maximum temperature reaches 36 ºC |
| Orange | Daily maximum temperature reaches 36 ºC for three consecutive days or daily maximum temperature reaches 38 ºC |
| Red | Daily maximum temperature reaches 38 ºC for three consecutive days |
Cold surge advisories are colour-coded as well. In the table below, ground level refers to altitude lower than 200 meters. The CWA notes that considering its geographical and climate conditions, the criteria for Lienchiang County is 4 degrees lower than the other areas.
| Signal | Cold surge criteria |
|---|---|
| Yellow | Minimum ground-level temperature is below 10 ºC. |
| Cold in early morning and evening, with a chance of minimum temperature dropping below 10 ºC and significant day-night temperature difference. | |
| Orange | Minimum ground-level temperature is below 6 ºC or minimum ground-level temperature is below 10 ºC and temperature remains below 12 ºC for 24 hours. |
| Very cold, with a chance of temperature remaining around or below 10 ºC or minimum temperature dropping below 6 ºC. | |
| Red | Temperature remains below 6 ºC for 24 hours. |
| Extremely cold, with a chance of temperature remaining under 6 ºC. |
Precipitation classification according to the CWA's standards is as follows—1. "heavy rain" (dayu 大雨), 2. "extremely heavy rain" (haoyu 豪雨), 3. "torrential rain" (da haoyu 大豪雨), and 4. "extremely torrential rain" (chaoda haoyu 超大豪雨).
| Classification | Precipitation criteria |
|---|---|
| Heavy rain | 24-hour accumulated rainfall exceeds 80 millimeters, or 1-hour rainfall exceeds 40 mm |
| Extremely heavy rain | 24-hour accumulated rainfall exceeds 200 mm, or 3-hour accumulated rainfall exceeds 100 mm |
| Torrential rain | 350-499 mm in 24 hours |
| Extremely torrential rain | 500 mm or more in 24 hours |
Details about dense fog advisory and strong wind advisory by CWA:
- Dense fog advisory—When the observation of horizontal visibility to less than 200 meters of fog appears, a dense fog advisory will be released.
- Strong wind advisory—When the forecast or observation of sustained wind up to strong wind or gusts up to gale, a strong wind/gale/storm advisory will be released for land or sea.
TOP HOME [◆ Geography/climate] [Climate]
Tropical cyclones
Taiwan is usually hit by 3-4 typhoons (taifeng 颱風) every year. In the 107 years from 1897 to 2003, a
total of 383 typhoons had a landfall on Taiwan or passed offshore without landfall but caused disasters on land. The
CWA uses four different categories for the classification of typhoons depending
on a storm's strength:
1. "severe typhoon" (qianglie taifeng 強烈颱風),
2. "typhoon" (zhongdu taifeng 中度颱風, literally 'moderate typhoon' or 'medium typhoon'),
3. "tropical storm" (qingdu taifeng 輕度颱風, literally 'mild typhoon'), and
4. "tropical depression" (redaixing diqiya 熱帶性低氣壓).
In general, the period between May and October is regarded as Taiwan's typhoon season. The peak frequency is in August, followed
by July and September (see table below, provided by CWA). The occurrence of typhoons in December is exceptionally rare but not
unheard of—for example, typhoon Nanmadol (nanmadou 南瑪都) made
landfall in Taiwan
on Dec. 4, 2004, killing two.
Monthly occurrences of typhoons in Taiwan between 1897 and 2003
| Month | April | May | June | July | Aug. | Sept. | Oct. | Nov. | Full year |
|---|---|---|---|---|---|---|---|---|---|
| Typhoons 1897-2003 | 2 | 14 | 28 | 92 | 121 | 87 | 31 | 8 | 383 |
| Average per year | 0.02 | 0.13 | 0.26 | 0.86 | 1.13 | 0.81 | 0.29 | 0.07 | 3.58 |
Major typhoons in the Taiwan area since WWII
| Year | Date(s) | Typhoon's name in English (and Chinese) | Fatalities |
|---|---|---|---|
| 1945 | Sept. 10–12 | Ursula (wusula 烏蘇拉) | > 140 |
| 1946 | Sept. 2 | Querida (kuiruida 葵瑞達 / kuilida 葵莉妲) | 154 |
| 1959 | Aug. 7 | Ellen (ailun 艾倫) | 667 |
| 1963 | Sept. 11–14 | Gloria (geleli 葛樂禮) | > 200 |
| 1975 | Aug. 2–8 | Nina (nina 妮娜) | 29 |
| Sept. 22 | Betty (bidi 比蒂) | 17 | |
| 1986 | Aug. 21–22 | Wayne (weien 韋恩) | 68 |
| 1987 | Oct. 26–28 | Lynn (lin'en 琳恩) | 13 |
| 1996 | July 31–Aug. 3 | Herb (hebo 賀伯) | 51 |
| 1997 | Aug. 18–23 | Winnie (wenni 溫妮) | 46 |
| 2000 | Aug. 22 | Bilis (bilisi 碧利斯) | 11 |
| 2001 | July 29–31 | Toraji (taozhi 桃芝) | 111 |
| Sept. 16–20 | Nari (nali 納莉) | 84 | |
| 2004 | July 1–2 | Mindulle (minduli 敏督利) ℹ | 18 |
| Aug. 24–26 | Aere (aili 艾利) ℹ | 30 | |
| Dec. 4 | Nanmadol (nanmadou 南瑪都) ℹ | 2 | |
| 2005 | July 17–19 | Haitang (haitang 海棠) ℹ | 12 |
| 2008 | Sept. 13–15 | Sinlaku (xinleke 辛樂克) ℹ | 4 |
| 2009 | Aug. 7–8 | Morakot (molake 莫拉克) ℹ | 614 |
| 2012 | Aug. 2 | Saola (sula 蘇拉) ℹ | 5 |
| 2013 | July 12–13 | Soulik (suli 蘇力) ℹ | 3 |
| 2015 | Aug. 7–8 | Soudelor (sudile 蘇迪勒) ℹ | 6 |
| 2016 | July 7–9 | Nepartak (nibote 尼伯特) ℹ | 3 |
| Sept. 27 | Megi (meiji 梅姬) ℹ | 7 | |
| 2019 | Aug. 9 | Lekima (liqima 利奇馬) ℹ | 1 |
| Aug. 24 | Bailu (bailu 白鹿) ℹ | 1 | |
| 2023 | July 27 | Doksuri (dusurui 杜蘇芮) ℹ | 1 |
| Oct. 5 | Koinu (xiaoquan 小犬) ℹ | 1 | |
| 2024 | July 24–25 | Gaemi (kaimi 凱米) ℹ | 10 |
| Oct. 3 | Krathon (shantuoer 山陀兒) ℹ | 4 | |
| Oct. 31 | Kong-rey (kangrui 康芮) ℹ | 3 | |
| 2025 | July 6–7 | Danas (dannasi 丹娜絲) ℹ | 2 |
| Sept. 22–23 | Ragasa (huajiasha 樺加沙) ℹ | 19 | |
| 2026 | July 10–11 | Bavi (bawei 巴威) ℹ | — |
A majority of victims claimed by typhoon Morakot in 2009 perished when the village of Shiaolin 小林村 (Jiaxian Township 甲仙鄉, Kaohsiung County) was buried by a massive landslide, the townships of Liugui 六龜鄉, Namaxia 那瑪夏鄉, and Taoyuan 桃源鄉 in the same county were also severely affected by comparable conditions.
TOP HOME [◆ Geography/climate] [Climate]
===== ===== ===== ===== =====
◆ Selected statistics Taiwan/ROC
- Preliminary notes
- Population statistics
- Public health statistics
- Economics and trade statistics
- Financial statistics
- Energy statistics
++++++++++ TOP HOME [next chapter] [previous chapter] ++++++++++
Preliminary notes
Statistics can be a helpful indicator for understanding the development stage of a country. For example, underdeveloped agricultural societies often have a high population growth, comparatively low life expectancy, high infant mortality, low number of hospital beds and physicians in relation to its population size, high illiteracy, low per capita GDP and GNI, and so on, while for a modern industrialized economy the respective figures would look much different.
Currently there is no single English-language source offered by ROC government agencies that provides comprehensive, detailed statistical data in all major areas. The data shown below are therefore derived from diverse sources.
The DGBAS's Statistical Yearbook of the ROC is the most important source for data in this chapter. A table providing links to available versions is shown directly below.
| 2006 | 2007 | 2008 | 2009 | 2010 |
| 2011 | 2012 | 2013 | 2014 | 2015 |
| 2016 | 2017 | 2018 | 2019 | 2020 |
| 2021 | 2022 | 2023 | 2024 | [2025] |
An additional source offered by the DGBAS for English-language statistics about Taiwan is the page "National Statistics".
TOP HOME [◆ Statistics] [Foreword]
Lost treasure
For decades, the most important source for statistical material from Taiwan/the ROC in English was the Taiwan Statistical Data Book, published annually since 1962, initially by the Council for U. S. Aid (Mei yuan yunyong weiyuanhui 美援運用委員會, abbrev. Mei yuan hui 美援會 in Chinese and CUSA in English) which would become the Council for Economic Planning and Development (CEPD) in 1977.
 On Jan. 22, 2014 the CEPD was
merged with the Research, Development and Evaluation Commission (RDEC) to constitute the National Development Council (NDC). While the publication of the Taiwan Statistical Data Book had
not been affected by the administrative changes until then, the NDC decided to terminate it following the 2019 edition.
On Jan. 22, 2014 the CEPD was
merged with the Research, Development and Evaluation Commission (RDEC) to constitute the National Development Council (NDC). While the publication of the Taiwan Statistical Data Book had
not been affected by the administrative changes until then, the NDC decided to terminate it following the 2019 edition.
The image directly below shows the text of an email sent by the NDC in response to a query from the chief researcher on Nov. 10, 2020 confirming the termination of the Taiwan Statistical Data Book.
A page on the NDC website listing previous editions of the Taiwan Statistical Data Book for access and download has since been deleted, but the editions shown below still circulate on the internet as PDF files. The editions 2002 through 2013 were published by the CEPD, the NDC published the editions 2014 through 2019.
| 2002 | 2003 | 2004 | 2005 | 2006 | 2007 |
| 2008 | 2009 | 2010 | 2011 | 2012 | 2013 |
| 2014 | 2015 | 2016 | 2017 | 2018 | 2019 |
Another annual statistical publication that the NDC took over from the CEPD are the Urban and Regional Development Statistics (dushi ji quyu fazhan tongji huibian 都市及區域發展統計彙編, abbrev. URDS) which are listed below in PDF format (1977 edition not available).
TOP HOME [◆ Statistics] [Foreword]
+++++ +++++ +++++ +++++ +++++ +++++ +++++ +++++ +++++ +++++
Population statistics
The population statistics shown here include recent data on the following tables:
● Total population, population growth, population density
● Age groups
● Gender balance
● Literacy rate
The main source for the population statistics on this page and elsewhere on this website is a Chinese-language database provided by the Department of Household Registration (neizhengbu huzhengsi 內政部戶政司) under the ROC MOI. Annual data refer to the figure for the end of the year (niandi 年底), monthly data to the figure for the end of the month (yuedi 月底).
Total population, population growth, population density
| Year | Population | + / – | Pop. growth |
Birth rate |
Births | Deaths | Area (km²) | Pop. density |
|---|---|---|---|---|---|---|---|---|
| 1946 | 6,090,860 | N/A | N/A | N/A | N/A | N/A | 35,961.2125 | 169.373 |
| 1947 | 6,497,734 | + 406,874 | 6.6800 % | N/A | N/A | N/A | " | 180.687 |
| 1948 | 6,807,601 | + 309,867 | 4.7688 % | N/A | N/A | N/A | " | 189.303 |
| 1949 | 7,396,931 | + 589,330 | 8.6569 % | N/A | N/A | N/A | " | 205.691 |
| 1950 | 7,554,399 | + 157,468 | 2.1288 % | N/A | N/A | N/A | " | 210.070 |
| 1951 | 7,869,247 | + 314,848 | 4.1677 % | N/A | N/A | N/A | " | 218.825 |
| 1952 | 8,128,374 | + 259,127 | 3.2929 % | N/A | N/A | N/A | " | 226.031 |
| 1953 | 8,438,016 | + 309,642 | 3.8093 % | N/A | N/A | N/A | " | 234.642 |
| 1954 | 8,749,151 | + 311,135 | 3.6873 % | N/A | N/A | N/A | " | 243.294 |
| 1955 | 9,077,643 | + 328,492 | 3.7545 % | N/A | N/A | N/A | " | 252.428 |
| 1956 | 9,390,381 | + 312,738 | 3.4451 % | N/A | N/A | N/A | " | 261.125 |
| 1957 | 9,690,250 | + 299,869 | 3.1933 % | N/A | N/A | N/A | " | 269.463 |
| 1958 | 10,039,435 | + 349,185 | 3.6034 % | 41.205 | 413,679 | 75,413 | " | 279.173 |
| 1959 | 10,431,341 | + 391,906 | 3.9036 % | 40.633 | 423,863 | 74,567 | " | 290.072 |
| 1960 | 10,792,202 | + 360,861 | 3.4593 % | 39.131 | 422,319 | 74,212 | " | 300.106 |
| 1961 | 11,149,139 | + 356,937 | 3.3073 % | 37.916 | 422,740 | 74,352 | " | 310.032 |
| 1962 | 11,511,728 | + 362,589 | 3.2521 % | 37.033 | 426,325 | 73,448 | 36,140.2675 | 318.529 |
| 1963 | 11,883,523 | + 371,795 | 3.2297 % | 35.949 | 427,212 | 72,266 | " | 328.816 |
| 1964 | 12,256,682 | + 373,159 | 3.1401 % | 34.250 | 419,797 | 69,774 | " | 339.141 |
| 1965 | 12,628,348 | + 371,666 | 3.0323 % | 32.436 | 409,620 | 68,414 | 36,140.2675 | 349.425 |
| 1966 | 12,992,763 | + 364,415 | 2.8856 % | 32.196 | 418,327 | 70,304 | " | 359.509 |
| 1967 | 13,296,571 | + 303,808 | 2.3382 % | 28.338 | 376,806 | 72,351 | " | 367.915 |
| 1968 | 13,650,370 | + 353,799 | 2.6608 % | 29.075 | 396,886 | 74,173 | " | 377.705 |
| 1969 | 14,334,862 | + 684,492 | 5.0144 % | 27.447 | 393,455 | 71,063 | " | 396.645 |
| 1970 | 14,675,964 | + 341,102 | 2.3795 % | 27.015 | 396,479 | 71,640 | " | 406.083 |
| 1971 | 14,994,823 | + 318,859 | 2.1726 % | 25.528 | 382,797 | 71,385 | 36,160.4965 | 414.674 |
| 1972 | 15,367,774 | + 372,951 | 2.4871 % | 23.950 | 368,067 | 71,988 | " | 424.987 |
| 1973 | 15,642,467 | + 274,693 | 1.7874 % | 23.591 | 369,022 | 73,959 | " | 432.584 |
| 1974 | 15,927,167 | + 284,700 | 1.8200 % | 23.210 | 369,671 | 75,224 | 36,160.5147 | 440.457 |
| 1975 | 16,223,089 | + 295,922 | 1.8579 % | 22.766 | 369,349 | 75,551 | 36,160.8363 | 448.636 |
| 1976 | 16,579,737 | + 356,648 | 2.1983 % | 25.641 | 425,125 | 77,035 | " | 458.499 |
| 1977 | 16,882,053 | + 302,316 | 1.8234 % | 23.538 | 397,373 | 79,766 | 36,168.8123 | 466.757 |
| 1978 | 17,202,491 | + 320,438 | 1.8980 % | 23.879 | 410,783 | 79,761 | " | 475.616 |
| 1979 | 17,543,067 | + 340,576 | 1.9798 % | 24.171 | 424,034 | 82,244 | 36,179.1159 | 484.894 |
| 1980 | 17,866,008 | + 322,941 | 1.8408 % | 23.165 | 413,881 | 84,333 | " | 493.821 |
| 1981 | 18,193,955 | + 327,947 | 1.8355 % | 22.758 | 414,069 | 87,192 | " | 502.885 |
| 1982 | 18,515,754 | + 321,799 | 1.7687 % | 21.887 | 405,263 | 87,578 | " | 511.780 |
| 1983 | 18,790,538 | + 274,784 | 1.4840 % | 20.405 | 383,439 | 90,951 | " | 519.375 |
| 1984 | 19,069,194 | + 278,656 | 1.4829 % | 19.455 | 371,008 | 89,915 | " | 527.077 |
| 1985 | 19,313,825 | + 244,631 | 1.2828 % | 17.925 | 346,208 | 92,348 | " | 533.839 |
| 1986 | 19,509,082 | + 195,257 | 1.1019 % | 15.850 | 309,230 | 95,057 | 36,181.9169 | 539.194 |
| 1987 | 19,725,010 | + 215,928 | 1.1068 % | 15.920 | 314,024 | 96,319 | " | 545.162 |
| 1988 | 19,954,397 | + 229,387 | 1.1629 % | 17.140 | 342,031 | 102,113 | " | 551.501 |
| 1989 | 20,156,587 | + 202,190 | 1.0132 % | 15.642 | 315,299 | 103,288 | 36,181.8718 | 557.090 |
| 1990 | 20,401,305 | + 244,718 | 1.2140 % | 16.450 | 335,618 | 105,669 | " | 563.854 |
| 1991 | 20,605,831 | + 204,526 | 1.0025 % | 15.623 | 321,932 | 106,284 | " | 569.507 |
| 1992 | 20,802,622 | + 196,791 | 0.9550 % | 15.461 | 321,632 | 110,516 | " | 574.945 |
| 1993 | 20,995,416 | + 192,794 | 0.9267 % | 15.508 | 325,613 | 110,901 | " | 580.274 |
| 1994 | 21,177,874 | + 182,458 | 0.8690 % | 15.248 | 322,938 | 113,866 | " | 585.317 |
| 1995 | 21,357,431 | + 179,557 | 0.8478 % | 15.431 | 329,581 | 119,112 | " | 590.279 |
| 1996 | 21,525,433 | + 168,002 | 0.7866 % | 15.123 | 325,545 | 122,489 | " | 594.923 |
| 1997 | 21,742,815 | + 217,382 | 1.0098 % | 14.993 | 326,002 | 121,000 | 36,188.0354 | 600.828 |
| 1998 | 21,928,591 | + 185,776 | 0.8544 % | 12.378 | 271,450 | 123,180 | " | 605.962 |
| 1999 | 22,092,387 | + 163,796 | 0.7469 % | 12.839 | 283,661 | 126,113 | " | 610.488 |
| 2000 | 22,276,672 | + 184,285 | 0.8341 % | 13.705 | 305,312 | 125,958 | " | 615.581 |
| 2001 | 22,405,568 | + 128,896 | 0.5786 % | 11.620 | 260,354 | 127,647 | " | 619.142 |
| 2002 | 22,520,776 | + 115,208 | 0.5141 % | 10.991 | 247,530 | 128,636 | " | 622.326 |
| 2003 | 22,604,550 | + 83,774 | 0.3719 % | 10.045 | 227,070 | 130,801 | " | 624.641 |
| 2004 | 22,689,122 | + 84,572 | 0.3741 % | 9.538 | 216,419 | 135,092 | " | 626.978 |
| 2005 | 22,770,383 | + 81,261 | 0.3581 % | 9.040 | 205,854 | 139,398 | " | 629.224 |
| 2006 | 22,876,527 | + 106,144 | 0.4661 % | 8.937 | 204,459 | 135,839 | " | 632.157 |
| 2007 | 22,958,360 | + 81,833 | 0.3577 % | 8.903 | 204,414 | 141,111 | 36,189.5050 | 634.392 |
| 2008 | 23,037,031 | + 78,671 | 0.3426 % | 8.626 | 198,733 | 143,624 | " | 636.566 |
| 2009 | 23,119,772 | + 82,741 | 0.3591 % | 8.274 | 191,310 | 143,582 | 36,191.4667 | 638.818 |
| 2010 | 23,162,123 | + 42,351 | 0.1831 % | 7.205 | 166,886 | 145,772 | " | 639.988 |
| 2011 | 23,224,912 | + 62,789 | 0.2710 % | 8.466 | 196,627 | 152,915 | 36,192.8155 | 641.699 |
| 2012 | 23,315,822 | + 90,910 | 0.3914 % | 9.842 | 229,481 | 154,251 | " | 644.211 |
| 2013 | 23,373,517 | + 57,695 | 0.2474 % | 8.518 | 199,113 | 155,908 | " | 645.805 |
| 2014 | 23,433,753 | + 60,236 | 0.2577 % | 8.977 | 210,383 | 163,929 | " | 647.469 |
| 2015 | 23,492,074 | + 58,321 | 0.2488 % | 9.092 | 213,598 | 163,858 | 36,197.0669 | 649.004 |
| 2016 | 23,539,816 | + 47,742 | 0.2032 % | 8.854 | 208,440 | 172,405 | " | 650.323 |
| 2017 | 23,571,227 | + 31,411 | 0.1334 % | 8.223 | 193,844 | 171,242 | " | 651.191 |
| 2018 | 23,588,932 | + 17,705 | 0.0751 % | 7.698 | 181,601 | 172,784 | " | 651.680 |
| 2019 | 23,603,121 | + 14,189 | 0.0601 % | 7.531 | 177,767 | 176,296 | " | 652.072 |
| 2020 | 23,561,236 | – 41,885 | – 0.1774 % | 7.013 | 165,249 | 173,156 | " | 650.915 |
| 2021 | 23,375,314 | – 185,922 | – 0.7891 % | 6.580 | 153,820 | 183,732 | " | 645.779 |
| 2022 | 23,264,640 | – 110,674 | – 0.4734 % | 5.974 | 138,986 | 207,230 | " | 642.721 |
| 2023 | 23,420,442 | + 155,802 | 0.6696 % | 5.788 | 135,571 | 205,368 | 36,197.3371 | 647.021 |
| 2024 | 23,400,220 | – 20,222 | – 0.0863 % | 5.763 | 134,856 | 202,107 | " | 646.462 |
| 2025 | 23,299,132 | – 101,088 | – 0.4319 % | 4.627 | 107,812 | 200,268 | " | 643.669 |
- Population figures for 1946–1970 without data for Kinmen and Lienchiang counties.
- The population growth figures ("+ / –") refer to the changes in comparison with the previous year.
- Birth rate means births per 1,000 persons.
- The population density shows the average number of persons per square kilometer.
- Since 2020 the number of deaths has been higher than the number of births.
- The 2025 birth rate was the lowest in the world.
Sources for all figures: MOI (population growth and birth rate calculated by the chief researcher)
Population figures of Taiwan's indigenous peoples can be found here, for a list showing the numbers of foreign residents in the ROC since 2013 click here.
Taiwan/the ROC reached its historical maximum population since 1949 in January 2020 with 23,604,265 persons. The following table shows the population figures for each month in 2019 and 2020. The figures in the column "+ / –" represent the population gains or losses compared with the previous month.
| Month | 2019 | + / – | 2020 | + / – | |
|---|---|---|---|---|---|
| January | 23,590,744 | + 1,812 | 23,604,265 | + 1,144 | |
| February | 23,590,004 | – 740 | 23,600,903 | – 3,362 | |
| March | 23,589,192 | – 812 | 23,596,493 | – 4,410 | |
| April | 23,589,312 | + 120 | 23,591,920 | – 4,573 | |
| May | 23,589,870 | + 558 | 23,586,562 | – 5,358 | |
| June | 23,591,031 | + 1,161 | 23,583,823 | – 2,739 | |
| July | 23,592,598 | + 1,567 | 23,578,705 | – 5,118 | |
| August | 23,593,794 | + 1,196 | 23,574,334 | – 4,371 | |
| September | 23,593,783 | – 11 | 23,568,378 | – 5,956 | |
| October | 23,596,266 | + 2,483 | 23,566,471 | – 1,907 | |
| November | 23,598,776 | + 2,510 | 23,563,356 | – 3,115 | |
| December | 23,603,121 | + 4,345 | 23,561,236 | – 2,120 |
For information about the population development in the ROC's special municipalities, counties and county-level cities since 1975, links are provided in the table below.
TOP HOME [◆ Statistics] [Population]
Age groups
| Year |
Under 15 | 15–64 | 65 and over | Total population | |||
|---|---|---|---|---|---|---|---|
| Persons | % | Persons | % | Persons | % | ||
| 1946 | 2,638,801 | 43.323 | 3,296,856 | 54.127 | 155,203 | 2.548 | 6,090,860 |
| 1947 | 2,750,200 | 42.325 | 3,583,450 | 55.149 | 164,084 | 2.525 | 6,497,734 |
| 1948 | 2,855,886 | 41.951 | 3,777,129 | 55.483 | 174,586 | 2.564 | 6,807,601 |
| 1949 | 3,040,727 | 41.107 | 4,171,582 | 56.396 | 184,622 | 2.495 | 7,396,931 |
| 1950 | 3,129,075 | 41.420 | 4,236,562 | 56.080 | 188,762 | 2.498 | 7,554,399 |
| 1951 | 3,312,125 | 42.089 | 4,363,734 | 55.453 | 193,388 | 2.457 | 7,869,247 |
| 1952 | 3,443,217 | 42.360 | 4,481,935 | 55.139 | 203,222 | 2.500 | 8,128,374 |
| 1953 | 3,605,158 | 42.725 | 4,624,361 | 54.803 | 208,497 | 2.470 | 8,438,016 |
| 1954 | 3,768,028 | 43.067 | 4,765,958 | 54.473 | 215,165 | 2.459 | 8,749,151 |
| 1955 | 3,940,266 | 43.406 | 4,914,716 | 54.140 | 222,661 | 2.452 | 9,077,643 |
| 1956 | 4,122,681 | 43.903 | 5,038,532 | 53.656 | 229,168 | 2.440 | 9,390,381 |
| 1957 | 4,288,542 | 44.256 | 5,165,077 | 53.301 | 236,631 | 2.441 | 9,690,250 |
| 1958 | 4,471,523 | 44.539 | 5,319,687 | 52.987 | 248,225 | 2.472 | 10,039,435 |
| 1959 | 4,674,570 | 44.812 | 5,500,538 | 52.730 | 256,233 | 2.456 | 10,431,341 |
| 1960 | 4,904,397 | 45.443 | 5,619,967 | 52.074 | 267,838 | 2.481 | 10,792,202 |
| 1961 | 5,111,677 | 45.848 | 5,759,469 | 51.658 | 277,993 | 2.493 | 11,149,139 |
| 1962 | 5,293,356 | 45.982 | 5,932,300 | 51.532 | 286,072 | 2.485 | 11,511,728 |
| 1963 | 5,445,602 | 45.824 | 6,134,810 | 51.624 | 303,111 | 2.550 | 11,883,523 |
| 1964 | 5,572,647 | 45.466 | 6,366,648 | 51.944 | 317,387 | 2.589 | 12,256,682 |
| 1965 | 5,667,341 | 44.877 | 6,626,496 | 52.473 | 334,511 | 2.648 | 12,628,348 |
| 1966 | 5,711,500 | 43.959 | 6,928,640 | 53.326 | 352,623 | 2.713 | 12,992,763 |
| 1967 | 5,754,885 | 43.280 | 7,174,806 | 53.959 | 366,880 | 2.759 | 13,296,571 |
| 1968 | 5,794,187 | 42.447 | 7,473,582 | 54.750 | 382,601 | 2.802 | 13,650,370 |
| 1969 | 5,806,201 | 40.504 | 8,124,663 | 56.677 | 403,998 | 2.818 | 14,334,862 |
| 1970 | 5,821,139 | 39.664 | 8,426,490 | 57.416 | 428,335 | 2.918 | 14,675,964 |
| 1971 | 5,805,182 | 38.714 | 8,735,778 | 58.258 | 453,863 | 3.026 | 14,994,823 |
| 1972 | 5,833,400 | 37.958 | 9,050,514 | 58.892 | 483,860 | 3.148 | 15,367,774 |
| 1973 | 5,804,956 | 37.110 | 9,330,399 | 59.647 | 507,112 | 3.241 | 15,642,467 |
| 1974 | 5,767,390 | 36.211 | 9,622,446 | 60.415 | 537,331 | 3.373 | 15,927,167 |
| 1975 | 5,737,621 | 35.367 | 9,917,400 | 61.131 | 568,068 | 3.501 | 16,223,089 |
| 1976 | 5,754,486 | 34.707 | 10,221,726 | 61.651 | 603,525 | 3.640 | 16,579,737 |
| 1977 | 5,735,285 | 33.972 | 10,499,744 | 62.194 | 647,024 | 3.832 | 16,882,053 |
| 1978 | 5,727,345 | 33.293 | 10,788,759 | 62.716 | 686,387 | 3.990 | 17,202,491 |
| 1979 | 5,740,709 | 32.723 | 11,074,575 | 63.127 | 727,783 | 4.148 | 17,543,067 |
| 1980 | 5,739,248 | 32.123 | 11,360,620 | 63.587 | 766,140 | 4.288 | 17,866,008 |
| 1981 | 5,754,357 | 31.627 | 11,636,753 | 63.959 | 802,845 | 4.412 | 18,193,955 |
| 1982 | 5,785,356 | 31.245 | 11,888,171 | 64.205 | 842,227 | 4.548 | 18,515,754 |
| 1983 | 5,789,914 | 30.812 | 12,121,271 | 64.507 | 879,353 | 4.679 | 18,790,538 |
| 1984 | 5,758,317 | 30.196 | 12,385,297 | 64.949 | 925,580 | 4.853 | 19,069,194 |
| 1985 | 5,716,144 | 29.596 | 12,620,626 | 65.345 | 977,055 | 5.058 | 19,313,825 |
| 1986 | 5,658,666 | 29.005 | 12,819,874 | 65.712 | 1,030,542 | 5.282 | 19,509,082 |
| 1987 | 5,600,598 | 28.393 | 13,030,985 | 66.063 | 1,093,427 | 5.543 | 19,725,010 |
| 1988 | 5,578,872 | 27.958 | 13,229,738 | 66.299 | 1,145,787 | 5.742 | 19,954,397 |
| 1989 | 5,543,197 | 27.500 | 13,412,069 | 66.539 | 1,201,321 | 5.959 | 20,156,587 |
| 1990 | 5,525,365 | 27.083 | 13,607,309 | 66.698 | 1,268,631 | 6.218 | 20,401,305 |
| 1991 | 5,427,150 | 26.337 | 13,833,252 | 67.132 | 1,345,429 | 6.529 | 20,605,831 |
| 1992 | 5,361,347 | 25.772 | 14,025,142 | 67.420 | 1,416,133 | 6.807 | 20,802,622 |
| 1993 | 5,279,705 | 25.146 | 14,224,910 | 67.752 | 1,490,801 | 7.100 | 20,995,416 |
| 1994 | 5,169,581 | 24.410 | 14,445,937 | 68.212 | 1,562,356 | 7.377 | 21,177,874 |
| 1995 | 5,076,083 | 23.767 | 14,650,294 | 68.595 | 1,631,054 | 7.636 | 21,357,431 |
| 1996 | 4,982,543 | 23.147 | 14,851,282 | 68.994 | 1,691,608 | 7.858 | 21,525,433 |
| 1997 | 4,914,280 | 22.601 | 15,076,479 | 69.340 | 1,752,056 | 8.058 | 21,742,815 |
| 1998 | 4,815,400 | 21.959 | 15,302,960 | 69.785 | 1,810,231 | 8.255 | 21,928,591 |
| 1999 | 4,734,596 | 21.430 | 15,492,319 | 70.125 | 1,865,472 | 8.443 | 22,092,387 |
| 2000 | 4,703,093 | 21.112 | 15,652,271 | 70.263 | 1,921,308 | 8.624 | 22,276,672 |
| 2001 | 4,661,884 | 20.806 | 15,770,327 | 70.385 | 1,973,357 | 8.807 | 22,405,568 |
| 2002 | 4,598,892 | 20.420 | 15,890,584 | 70.559 | 2,031,300 | 9.019 | 22,520,776 |
| 2003 | 4,481,620 | 19.826 | 16,035,196 | 70.937 | 2,087,734 | 9.235 | 22,604,550 |
| 2004 | 4,387,082 | 19.335 | 16,151,565 | 71.186 | 2,150,475 | 9.478 | 22,689,122 |
| 2005 | 4,259,049 | 18.704 | 16,294,530 | 71.560 | 2,216,804 | 9.735 | 22,770,383 |
| 2006 | 4,145,631 | 18.121 | 16,443,867 | 71.880 | 2,287,029 | 9.997 | 22,876,527 |
| 2007 | 4,030,645 | 17.556 | 16,584,623 | 72.237 | 2,343,092 | 10.205 | 22,958,360 |
| 2008 | 3,905,203 | 16.951 | 16,729,608 | 72.620 | 2,402,220 | 10.427 | 23,037,031 |
| 2009 | 3,778,018 | 16.341 | 16,884,106 | 73.028 | 2,457,648 | 10.630 | 23,119,772 |
| 2010 | 3,624,311 | 15.647 | 17,049,919 | 73.611 | 2,487,893 | 10.741 | 23,162,123 |
| 2011 | 3,501,790 | 15.077 | 17,194,873 | 74.036 | 2,528,249 | 10.885 | 23,224,912 |
| 2012 | 3,411,677 | 14.632 | 17,303,993 | 74.215 | 2,600,152 | 11.151 | 23,315,822 |
| 2013 | 3,346,601 | 14.317 | 17,332,510 | 74.154 | 2,694,406 | 11.527 | 23,373,517 |
| 2014 | 3,277,300 | 13.985 | 17,347,763 | 74.028 | 2,808,690 | 11.985 | 23,433,753 |
| 2015 | 3,187,780 | 13.569 | 17,365,715 | 73.921 | 2,938,579 | 12.508 | 23,492,074 |
| 2016 | 3,141,881 | 13.347 | 17,291,830 | 73.457 | 3,106,105 | 13.195 | 23,539,816 |
| 2017 | 3,091,873 | 13.117 | 17,211,341 | 73.018 | 3,268,013 | 13.864 | 23,571,227 |
| 2018 | 3,048,227 | 12.922 | 17,107,188 | 72.522 | 3,433,517 | 14.555 | 23,588,932 |
| 2019 | 3,010,351 | 12.754 | 16,985,643 | 71.963 | 3,607,127 | 15.282 | 23,603,121 |
| 2020 | 2,963,396 | 12.577 | 16,810,525 | 71.348 | 3,787,315 | 16.074 | 23,561,236 |
| 2021 | 2,889,908 | 12.363 | 16,546,373 | 70.785 | 3,939,033 | 16.851 | 23,375,314 |
| 2022 | 2,819,169 | 12.117 | 16,359,678 | 70.319 | 4,085,793 | 17.562 | 23,264,640 |
| 2023 | 2,793,413 | 11.927 | 16,330,044 | 69.725 | 4,296,985 | 18.347 | 23,420,442 |
| 2024 | 2,742,386 | 11.719 | 16,169,127 | 69.098 | 4,488,707 | 19.182 | 23,400,220 |
| 2025 | 2,681,890 | 11.510 | 15,944,087 | 68.432 | 4,673,155 | 20.057 | 23,299,132 |
Number of persons provided by the MOI, percentages calculated by the chief researcher.
The UN defines a society as "aging" when 7 percent of its population is older than 65. When that age group accounts for 14 percent of a society, it is called an "aged society", and when it reaches 20 percent, it is called a "super-aged society".
Number of centenarians since 1991
| Year | Persons | Year | Persons | Year | Persons | Year | Persons | |||
|---|---|---|---|---|---|---|---|---|---|---|
| 1991 | 0 | 2000 | 966 | 2009 | 2,001 | 2018 | 3,500 | |||
| 1992 | 291 | 2001 | 1,123 | 2010 | 2,111 | 2019 | 3,806 | |||
| 1993 | 380 | 2002 | 1,298 | 2011 | 2,141 | 2020 | 4,242 | |||
| 1994 | 497 | 2003 | 1,421 | 2012 | 2,599 | 2021 | 4,738 | |||
| 1995 | 505 | 2004 | 1,573 | 2013 | 2,838 | 2022 | 4,901 | |||
| 1996 | 583 | 2005 | 1,743 | 2014 | 2,995 | 2023 | 4,984 | |||
| 1997 | 717 | 2006 | 1,944 | 2015 | 3,067 | 2024 | 5,165 | |||
| 1998 | 803 | 2007 | 1,962 | 2016 | 3,068 | 2025 | 5,528 | |||
| 1999 | 866 | 2008 | 1,873 | 2017 | 3,326 | 2026 | N/A |
Please note that the relevant file of the MOI Department of Household Registration about age groups since 1974 [縣市人口按性別及五齡組(63)] consistently listed the number of centenarians between 1974 and 1991 as zero.
TOP HOME [◆ Statistics] [Population]
Gender balance
| Year |
Total population (persons) |
Male population ♂ | Female population ♀ | ||
|---|---|---|---|---|---|
| (persons) | (ratio) | (persons) | (ratio) | ||
| 1946 | 6,090,860 | 3,060,527 | 50.247 % | 3,030,333 | 49.752 % |
| 1947 | 6,497,734 | 3,272,297 | 50.360 % | 3,225,437 | 49.639 % |
| 1948 | 6,807,601 | 3,438,230 | 50.505 % | 3,369,371 | 49.494 % |
| 1949 | 7,396,931 | 3,766,018 | 50.913 % | 3,630,913 | 49.086 % |
| 1950 | 7,554,399 | 3,853,799 | 51.013 % | 3,700,600 | 48.986 % |
| 1951 | 7,869,247 | 4,016,708 | 51.043 % | 3,852,539 | 48.956 % |
| 1952 | 8,128,374 | 4,156,469 | 51.135 % | 3,971,905 | 48.864 % |
| 1953 | 8,438,016 | 4,326,708 | 51.276 % | 4,111,308 | 48.723 % |
| 1954 | 8,749,151 | 4,487,191 | 51.287 % | 4,261,960 | 48.712 % |
| 1955 | 9,077,643 | 4,647,207 | 51.193 % | 4,430,436 | 48.806 % |
| 1956 | 9,390,381 | 4,796,195 | 51.075 % | 4,594,186 | 48.924 % |
| 1957 | 9,690,250 | 4,942,534 | 51.005 % | 4,747,716 | 48.994 % |
| 1958 | 10,039,435 | 5,121,028 | 51.009 % | 4,918,407 | 49.990 % |
| 1959 | 10,431,341 | 5,336,555 | 51.158 % | 5,094,786 | 48.841 % |
| 1960 | 10,792,202 | 5,525,062 | 51.194 % | 5,267,140 | 48.805 % |
| 1961 | 11,149,139 | 5,715,463 | 51.263 % | 5,433,676 | 48.736 % |
| 1962 | 11,511,728 | 5,902,218 | 51.271 % | 5,609,510 | 48.728 % |
| 1963 | 11,883,523 | 6,097,634 | 51.311 % | 5,785,889 | 48.688 % |
| 1964 | 12,256,682 | 6,294,935 | 51.359 % | 5,961,747 | 48.640 % |
| 1965 | 12,628,348 | 6,491,539 | 51.404 % | 6,136,809 | 48.595 % |
| 1966 | 12,992,763 | 6,684,006 | 51.444 % | 6,308,757 | 48.555 % |
| 1967 | 13,296,571 | 6,841,155 | 51.450 % | 6,455,416 | 48.549 % |
| 1968 | 13,650,370 | 7,030,787 | 51.506 % | 6,619,583 | 48.493 % |
| 1969 | 14,334,862 | 7,554,131 | 52.697 % | 6,780,731 | 47.302 % |
| 1970 | 14,675,964 | 7,732,867 | 52.690 % | 6,943,097 | 47.309 % |
| 1971 | 14,994,823 | 7,895,140 | 52.652 % | 7,099,683 | 47.347 % |
| 1972 | 15,367,774 | 8,078,038 | 52.564 % | 7,289,736 | 47.435 % |
| 1973 | 15,642,467 | 8,215,703 | 52.521 % | 7,426,764 | 47.478 % |
| 1974 | 15,927,167 | 8,354,012 | 52.451 % | 7,573,155 | 47.548 % |
| 1975 | 16,223,089 | 8,501,391 | 52.403 % | 7,721,698 | 47.596 % |
| 1976 | 16,579,737 | 8,678,165 | 52.341 % | 7,901,572 | 47.658 % |
| 1977 | 16,882,053 | 8,829,635 | 52.301 % | 8,052,418 | 47.698 % |
| 1978 | 17,202,491 | 8,991,263 | 52.267 % | 8,211,228 | 47.732 % |
| 1979 | 17,543,067 | 9,160,239 | 52.215 % | 8,382,828 | 47.784 % |
| 1980 | 17,866,008 | 9,320,105 | 52.166 % | 8,545,903 | 47.833 % |
| 1981 | 18,193,955 | 9,479,508 | 52.102 % | 8,714,447 | 47.897 % |
| 1982 | 18,515,754 | 9,636,285 | 52.043 % | 8,879,469 | 47.956 % |
| 1983 | 18,790,538 | 9,769,572 | 51.991 % | 9,020,966 | 48.008 % |
| 1984 | 19,069,194 | 9,904,853 | 51.941 % | 9,164,341 | 48.058 % |
| 1985 | 19,313,825 | 10,023,344 | 51.897 % | 9,290,481 | 48.102 % |
| 1986 | 19,509,082 | 10,114,710 | 51.846 % | 9,394,372 | 48.153 % |
| 1987 | 19,725,010 | 10,217,434 | 51.799 % | 9,507,576 | 48.200 % |
| 1988 | 19,954,397 | 10,328,081 | 51.758 % | 9,626,316 | 48.241 % |
| 1989 | 20,156,587 | 10,424,102 | 51.715 % | 9,732,485 | 48.284 % |
| 1990 | 20,401,305 | 10,540,635 | 51.666 % | 9,860,670 | 48.333 % |
| 1991 | 20,605,831 | 10,640,276 | 51.637 % | 9,965,555 | 48.362 % |
| 1992 | 20,802,622 | 10,734,609 | 51.602 % | 10,068,013 | 48.397 % |
| 1993 | 20,995,416 | 10,824,161 | 51.554 % | 10,171,255 | 48.445 % |
| 1994 | 21,177,874 | 10,907,032 | 51.502 % | 10,270,842 | 48.497 % |
| 1995 | 21,357,431 | 10,990,657 | 51.460 % | 10,366,774 | 48.539 % |
| 1996 | 21,525,433 | 11,065,798 | 51.408 % | 10,459,635 | 48.591 % |
| 1997 | 21,742,815 | 11,163,764 | 51.344 % | 10,579,051 | 48.655 % |
| 1998 | 21,928,591 | 11,243,408 | 51.272 % | 10,685,183 | 48.727 % |
| 1999 | 22,092,387 | 11,312,728 | 51.206 % | 10,779,659 | 48.793 % |
| 2000 | 22,276,672 | 11,392,050 | 51.138 % | 10,884,622 | 48.861 % |
| 2001 | 22,405,568 | 11,441,651 | 51.066 % | 10,963,917 | 48.933 % |
| 2002 | 22,520,776 | 11,485,409 | 50.999 % | 11,035,367 | 49.000 % |
| 2003 | 22,604,550 | 11,515,062 | 50.941 % | 11,089,488 | 49.058 % |
| 2004 | 22,689,122 | 11,541,585 | 50.868 % | 11,147,537 | 49.131 % |
| 2005 | 22,770,383 | 11,562,440 | 50.778 % | 11,207,943 | 49.221 % |
| 2006 | 22,876,527 | 11,591,707 | 50.670 % | 11,284,820 | 49.239 % |
| 2007 | 22,958,360 | 11,608,767 | 50.564 % | 11,349,593 | 49.435 % |
| 2008 | 23,037,031 | 11,626,351 | 50.468 % | 11,410,680 | 49.531 % |
| 2009 | 23,119,772 | 11,636,734 | 50.332 % | 11,483,038 | 49.667 % |
| 2010 | 23,162,123 | 11,635,225 | 50.233 % | 11,526,898 | 49.766 % |
| 2011 | 23,224,912 | 11,645,674 | 50.143 % | 11,579,238 | 49.856 % |
| 2012 | 23,315,822 | 11,673,319 | 50.066 % | 11,642,503 | 49.933 % |
| 2013 | 23,373,517 | 11,684,674 | 49.991 % | 11,688,843 | 50.008 % |
| 2014 | 23,433,753 | 11,697,971 | 49.919 % | 11,735,782 | 50.080 % |
| 2015 | 23,492,074 | 11,712,047 | 49.855 % | 11,780,027 | 50.144 % |
| 2016 | 23,539,816 | 11,719,270 | 49.784 % | 11,820,546 | 50.215 % |
| 2017 | 23,571,227 | 11,719,580 | 49.719 % | 11,851,647 | 50.280 % |
| 2018 | 23,588,932 | 11,712,913 | 49.654 % | 11,876,019 | 50.345 % |
| 2019 | 23,603,121 | 11,705,186 | 49.591 % | 11,897,935 | 50.408 % |
| 2020 | 23,561,236 | 11,673,765 | 49.546 % | 11,887,471 | 50.453 % |
| 2021 | 23,375,314 | 11,578,696 | 49.533 % | 11,796,618 | 50.466 % |
| 2022 | 23,264,640 | 11,499,136 | 49.427 % | 11,765,504 | 50.572 % |
| 2023 | 23,420,442 | 11,553,267 | 49.329 % | 11,867,175 | 50.670 % |
| 2024 | 23,400,220 | 11,526,193 | 49.256 % | 11,874,027 | 50.743 % |
| 2025 | 23,299,132 | 11,462,401 | 49.196 % | 11,836,731 | 50.803 % |
Number of persons provided by the MOI, percentages calculated by the chief researcher.
Data with gender reference offered in MOI statistics (and by most websites of ROC government agencies in general) provide information about male and female only, with no other options available.
Please note that the gender imbalance in Taiwan/the ROC reached its highest level at the end of the year 1969—total population then was 13,650,370, with 7,554,131 males (52.697 %) and 6,780,731 females (47.302 %). Since the end of November 2013 females have been outnumbering males in the ROC.
| Month | Total population | Male ♂ | Female ♀ |  |
|---|---|---|---|---|
| August 2013 | 23,354,061 | 11,680,706 | 11,673,355 | |
| September 2013 | 23,356,588 | 11,680,729 | 11,675,859 | |
| October 2013 | 23,361,147 | 11,681,448 | 11,679,699 | |
| November 2013 | 23,367,320 | 11,683,187 | 11,684,133 | |
| December 2013 | 23,373,517 | 11,684,674 | 11,688,843 | |
| January 2014 | 23,377,515 | 11,685,438 | 11,692,077 |
The number of males peaked at the end of January 2017 with 11,719,646 individuals, the number of females reached its highest level at the end of January 2020 with 11,899,957 individuals.
| Month | Total population | Male ♂ | Female ♀ |  |
|---|---|---|---|---|
| November 2016 | 23,532,065 | 11,716,952 | 11,815,113 | |
| December 2016 | 23,539,816 | 11,719,270 | 11,820,546 | |
| January 2017 | 23,543,346 | 11,719,646 | 11,823,700 | |
| February 2017 | 23,544,189 | 11,718,795 | 11,825,394 | |
| March 2017 | 23,545,680 | 11,718,068 | 11,827,612 |
| Month | Total population | Male ♂ | Female ♀ |  |
|---|---|---|---|---|
| November 2019 | 23,598,776 | 11,704,260 | 11,894,516 | |
| December 2019 | 23,603,121 | 11,705,186 | 11,897,935 | |
| January 2020 | 23,604,265 | 11,704,308 | 11,899,957 | |
| February 2020 | 23,600,903 | 11,701,322 | 11,899,581 | |
| March 2020 | 23,596,493 | 11,697,977 | 11,898,516 |
TOP HOME [◆ Statistics] [Population]
Literacy rate
The table directly below shows the percentage of illiterates among persons aged 15 and above at the end of the school year.
| Year | % | Year | % | Year | % | Year | % | |||
|---|---|---|---|---|---|---|---|---|---|---|
| 1997 | 5.34 | 2004 | 2.84 | 2011 | 1.83 | 2018 | 1.13 | |||
| 1998 | 5.08 | 2005 | 2.67 | 2012 | 1.71 | 2019 | 1.04 | |||
| 1999 | 4.72 | 2006 | 2.52 | 2013 | 1.61 | 2020 | 0.97 | |||
| 2000 | 4.45 | 2007 | 2.37 | 2014 | 1.50 | 2021 | 0.91 | |||
| 2001 | 4.21 | 2008 | 2.22 | 2015 | 1.40 | 2022 | 0.83 | |||
| 2002 | 3.97 | 2009 | 2.09 | 2016 | 1.30 | 2023 | 0.75 | |||
| 2003 | 3.03 | 2010 | 1.96 | 2017 | 1.21 | 2024 | 0.68 |
Source: MOE main education statistical indicators, see III. Stucture of education; 2. Educational attainment of population—aged 15 and above
The following table lists the ROC government's expenditures for education in relation to the total net expenditures (unit: million NT$).
| Year | Total | Education | % | Year | Total | Education | % | 1981 | 425,731 | 60,262.157 | 14.154 | 2005 | 2,291,999 | 457,296.815 | 19.951 |
|---|---|---|---|---|---|---|---|---|
| 1986 | 616,718 | 112,949.397 | 18.314 | 2006 | 2,214,226 | 469,392.790 | 21.198 | |
| 1987 | 641,911 | 119,030.192 | 18.543 | 2007 | 2,290,169 | 476,822.193 | 20.820 | |
| 1988 | 726,468 | 135,970.263 | 18.716 | 2008 | 2,343,585 | 481,068.268 | 20.527 | |
| 1989 | 1,207,351 | 163,094.485 | 13.580 | 2009 | 2,670,898 | 532,325.154 | 19.930 | |
| 1990 | 1,097,518 | 202,364.354 | 18.438 | 2010 | 2,566,804 | 516,804.324 | 20.134 | |
| 1991 | 1,275,613 | 247,488.080 | 19.401 | 2011 | 2,612,947 | 537,799.401 | 20.582 | |
| 1992 | 1,561,930 | 290,019.588 | 18.568 | 2012 | 2,677,984 | 548,815.737 | 20.493 | |
| 1993 | 1,756,306 | 332,463.417 | 18.929 | 2013 | 2,665,241 | 553,419.602 | 20.764 | |
| 1994 | 1,826,367 | 350,053.223 | 19.166 | 2014 | 2,645,712 | 564,144.138 | 21.322 | |
| 1995 | 1,910,066 | 366,902.255 | 19.208 | 2015 | 2,645,189 | 575,286.556 | 21.748 | |
| 1996 | 1,843,786 | 407,595.911 | 22.106 | 2016 | 2,745,305 | 590,263.123 | 21.500 | |
| 1997 | 1,878,764 | 420,905.497 | 22.403 | 2017 | 2,778,361 | 601,520.617 | 21.650 | |
| 1998 | 1,992,593 | 430,675.819 | 21.613 | 2018 | 2,845,491 | 614,799.693 | 21.606 | |
| 1999 | 2,050,004 | 453,089.741 | 22.101 | 2019 | 2,911,648 | 615,245.161 | 21.130 | |
| 2000 | 3,140,936 | 381,937.815 | 12.159 | 2020 | 3,241,989 | 648,450.490 | 20.001 | |
| 2001 | 2,271,755 | 406,886.944 | 17.910 | 2021 | 3,360,265 | 698,356.958 | 20.782 | |
| 2002 | 2,144,994 | 423,036.518 | 19.722 | 2022 | 3,652,373 | 727,888.657 | 19.929 | |
| 2003 | 2,216,514 | 424,811.457 | 19.165 | 2023 | 4,033,626 | 736,383.054 | 18.256 | |
| 2004 | 2,245,047 | 441,251.948 | 19.654 | 2024 | 4,074,169 | 776,387.782 | 19.056 |
Sources for the educational expenditures include the Statistical Yearbook of the ROC—2006, p. 92 (table 47); 2009, p. 90 (table 47); 2014, p. 88 (table 46); 2020 and 2024, p. 23 (table 12). The sources for data concerning the government's total net expenditures can be found here. The percentages were calculated by the chief researcher.
TOP HOME [◆ Statistics] [Population]

For comparison, the table directly below shows data from the NDC's
Taiwan Statistical Data Book 2019 (age groups: tables 2-6a, 2-6b; literacy rates: table 2-4).
| Year |
Age groups (% of population) | Literacy rate (%) |
||
|---|---|---|---|---|
| Under 15 | 15–64 | 65 and over | ||
| 1952 | 42.4 | 55.1 | 2.5 | N/A |
| 1955 | 43.4 | 54.1 | 2.5 | N/A |
| 1960 | 45.4 | 52.1 | 2.5 | N/A |
| 1965 | 44.9 | 52.5 | 2.6 | N/A |
| 1970 | 39.7 | 57.4 | 2.9 | N/A |
| 1975 | 35.4 | 61.1 | 3.5 | 84.24 |
| 1980 | 32.1 | 63.6 | 4.3 | 87.74 |
| 1985 | 29.6 | 65.3 | 5.1 | 90.38 |
| 1990 | 27.1 | 66.7 | 6.2 | 92.41 |
| 1995 | 23.8 | 68.6 | 7.6 | 94.01 |
| 2000 | 21.1 | 70.3 | 8.6 | 95.55 |
| 2005 | 18.7 | 71.6 | 9.7 | 97.33 |
| 2009 | 16.3 | 73.0 | 10.6 | 97.91 |
| 2010 | 15.6 | 73.6 | 10.7 | 98.04 |
| 2011 | 15.1 | 74.0 | 10.9 | 98.17 |
| 2012 | 14.6 | 74.2 | 11.2 | 98.29 |
| 2013 | 14.3 | 74.2 | 11.5 | 98.39 |
| 2014 | 14.0 | 74.0 | 12.0 | 98.50 |
| 2015 | 13.6 | 73.9 | 12.5 | 98.60 |
| 2016 | 13.3 | 73.5 | 13.2 | 98.70 |
| 2017 | 13.1 | 73.0 | 13.9 | 98.79 |
| 2018 | 12.9 | 72.5 | 14.6 | 98.87 |
TOP HOME [◆ Statistics] [Population]
Public health statistics
The public health statistics shown here include recent data on the following tables:
● Life expectancy
● Infant mortality rate
● Physicians and hospital beds per population
Main source for the public health statistics shown here is the DGBAS's Statistical Yearbook of the ROC 2020. Other useful statistics concerning that topic can be found on the MOHW website.
Life expectancy
[Unit—years]
| Year |
Life expectancy | Year |
Life expectancy | |||
|---|---|---|---|---|---|---|
| Male ♂ | Female ♀ | Male ♂ | Female ♀ | |||
| 1951 | 2016 | |||||
| 1971 | 2017 | |||||
| 1981 | 2018 | |||||
| 1991 | 2019 | |||||
| 2001 | 2020 | |||||
| 2011 | 2021 | |||||
| 2012 | 2022 | |||||
| 2013 | 2023 | |||||
| 2014 | 2024 | |||||
| 2015 | ||||||
Source: Statistical Yearbook of the ROC 2020, 2021, 2022, 2023, 2024 (table 6)
TOP HOME [◆ Statistics] [Public health]
Infant mortality rate
[Unit—deaths per 1,000 life births]
| Year | Infant mortality | Year | Infant mortality | Year | Infant mortality | ||
|---|---|---|---|---|---|---|---|
| 1950 | 91.721 | 2000 | 6.496 | 2018 | 3.713 | ||
| 1955 | 70.175 | 2005 | 5.693 | 2019 | 3.615 | ||
| 1960 | 53.549 | 2010 | 4.790 | 2020 | 3.518 | ||
| 1965 | 44.940 | 2011 | 4.604 | 2021 | 3.420 | ||
| 1970 | 30.026 | 2012 | 4.419 | 2022 | 3.323 | ||
| 1975 | 13.187 | 2013 | 4.234 | 2023 | 3.225 | ||
| 1980 | 10.075 | 2014 | 4.130 | 2024 | 3.163 | ||
| 1985 | 7.446 | 2015 | 4.026 | 2025 | 3.101 | ||
| 1990 | 5.715 | 2016 | 3.921 | ||||
| 1995 | 5.954 | 2017 | 3.817 | ||||
Source: MacroTrends.net
TOP HOME [◆ Statistics] [Public health]
Physicians and hospital beds per population
[Unit—per 10,000 persons]
| Year | Physicians | Beds | Year | Physicians | Beds | |
|---|---|---|---|---|---|---|
| 1954 | 6.31 | 3.29 | 2016 | 21.79 | 69.31 | |
| 1971 | 5.23 | 15.99 | 2017 | 22.51 | 69.83 | |
| 1981 | 7.52 | 24.29 | 2018 | 23.04 | 71.02 | |
| 1991 | 11.49 | 45.14 | 2019 | 24.00 | 71.29 | |
| 2001 | 15.42 | 56.98 | 2020 | 24.76 | 72.06 | |
| 2011 | 19.62 | 69.09 | 2021 | 25.52 | 73.03 | |
| 2012 | 20.02 | 69.01 | 2022 | 26.11 | 73.97 | |
| 2013 | 20.51 | 68.21 | 2023 | 26.43 | 73.32 | |
| 2014 | 20.96 | 68.91 | 2024 | 27.04 | 72.93 | |
| 2015 | 21.41 | 69.03 | ||||
Source: Statistical Yearbook of the ROC 2020, 2021, 2022, 2023, 2024 (table 21)
TOP HOME [◆ Statistics] [Public health]
For comparison, the table directly below shows data from the NDC's
Taiwan Statistical Data Book 2019 (life expectancy, hospital beds: table 14-6; persons per physician: table 14-2).
| Year | Life expectancy | Hospital beds | Persons per physician | ||
|---|---|---|---|---|---|
| Total | Male | Female | |||
| 1961 | N/A | 62.64 | 67.18 | 3.70 | 1,661 * |
| 1965 | N/A | 65.10 | 69.71 | 3.52 | 1,901 |
| 1970 | N/A | 66.66 | 71.56 | 3.96 | 2,240 |
| 1975 | N/A | 68.27 | 73.42 | 18.85 | 1,492 |
| 1980 | N/A | 69.57 | 74.55 | 22.22 | 1,323 |
| 1985 | 73.02 | 70.82 | 75.81 | 38.47 | 1,130 |
| 1990 | 73.79 | 71.33 | 76.75 | 43.80 | 913 |
| 1995 | 74.53 | 71.85 | 77.74 | 52.62 | 777 |
| 2000 | 76.46 | 73.83 | 79.56 | 56.78 | 669 |
| 2005 | 77.42 | 74.50 | 80.80 | 64.29 | 588 |
| 2010 | 79.18 | 76.13 | 82.55 | 68.61 | 524 |
| 2011 | 79.15 | 75.96 | 82.63 | 69.09 | 510 |
| 2012 | 79.51 | 76.43 | 82.82 | 69.01 | 500 |
| 2013 | 80.02 | 76.91 | 83.36 | 68.21 | 488 |
| 2014 | 79.84 | 76.72 | 83.19 | 68.91 | 477 |
| 2015 | 80.20 | 77.01 | 83.62 | 69.03 | 467 |
| 2016 | 80.00 | 76.81 | 83.42 | 69.31 | 459 |
| 2017 | 80.39 | 77.28 | 83.70 | 69.83 | 444 |
| 2018 | N/A | N/A | N/A | 71.02 | 434 |
Note: Life expectancy at birth in years. Hospital beds per 10,000 persons. Persons served by each physician including TCM doctors (*: 1960).
TOP HOME [◆ Statistics] [Public health]
Economics and trade statistics
The economics and trade statistics shown here include recent data on the following tables:
● Annual economic growth rate
● GDP and GNI
● Percentage of economic sectors in GDP
● Exports and imports
● Inflation
● Unemployment rate
Main source for the economics statistics shown here is the DGBAS's Statistical Yearbook of the ROC 2006–2020. GDP stands for Gross Domestic Product, GNI for Gross National Income, CPI for Consumer Price Index. Other useful statistics concerning that topic can be found on the websites of the MOEA and of the MOEA's Bureau of Foreign Trade (BOFT).
Annual economic growth rate
| Year | Growth | Year | Growth | Year | Growth | Year | Growth | |||
|---|---|---|---|---|---|---|---|---|---|---|
| 1971 | 13.43 % | 2002 | 5.26 % | 2010 | 10.63 % | 2018 | 2.91 % | |||
| 1981 | 7.11 % | 2003 | 3.67 % | 2011 | 3.67 % | 2019 | 3.06 % | |||
| 1986 | 11.49 % | 2004 | 6.19 % | 2012 | 2.22 % | 2020 | 3.42 % | |||
| 1991 | 8.37 % | 2005 | 4.70 % | 2013 | 2.48 % | 2021 | 6.72 % | |||
| 1996 | 6.30 % | 2006 | 5.62 % | 2014 | 4.72 % | 2022 | 2.68 % | |||
| 1999 | 5.97 % | 2007 | 6.52 % | 2015 | 1.47 % | 2023 | 1.12 % | |||
| 2000 | 5.77 % | 2008 | 0.70 % | 2016 | 2.17 % | 2024 | 4.84 % | |||
| 2001 | – 1.40 % | 2009 | – 1.57 % | 2017 | 3.66 % | |||||
Source: Statistical Yearbook of the ROC 2006 (table 93), 2010 (table 94); 2015, 2020, 2021, 2022, 2023, 2024
(table 39). The chief researcher would like to point out that the figures for the economic growth
presented by the DGBAS in their yearbooks (YB) are frequently adjusted and therefore
have to be regarded with caution. For example, the respective figure for the year 2001 has been as follows—YB 2006: – 2.17 %
(p. 153, table 93), YB 2010: – 1.65 % (p. 155, table 94), YB 2015: – 1.26 % (p. 76, table 39), YB 2020: – 1.40 % (p. 76,
table 39).
The chief researcher would like to point out that the figures for the economic growth
presented by the DGBAS in their yearbooks (YB) are frequently adjusted and therefore
have to be regarded with caution. For example, the respective figure for the year 2001 has been as follows—YB 2006: – 2.17 %
(p. 153, table 93), YB 2010: – 1.65 % (p. 155, table 94), YB 2015: – 1.26 % (p. 76, table 39), YB 2020: – 1.40 % (p. 76,
table 39).
TOP HOME [◆ Statistics] [Economics/trade]
GDP and GNI
[GDP and GNI at current prices.]
| Period/ year |
Total GDP (US$ million) |
Per capita GDP | Total GNI (NT$ million) |
Per capita GNI | ||
|---|---|---|---|---|---|---|
| (NT$) | (US$) | (NT$) | (US$) | |||
| 1951 | 1,197 | 1,589 | 154 | 12,320 | 1,588 | 154 |
| 1971 | 6,727 | 18,043 | 451 | 268,962 | 18,035 | 451 |
| 1981 | 49,047 | 100,079 | 2,720 | 1,794,778 | 99,544 | 2,706 |
| 1991 | 187,100 | 244,739 | 9,125 | 5,153,461 | 251,345 | 9,372 |
| 2001 | 299,303 | 452,951 | 13,397 | 10,308,613 | 461,419 | 13,647 |
| 2011 | 483,957 | 614,922 | 20,866 | 14,634,307 | 630,965 | 21,410 |
| 2012 | 495,536 | 630,749 | 21,295 | 15,109,951 | 649,322 | 21,922 |
| 2013 | 512,957 | 654,142 | 21,973 | 15,673,232 | 671,384 | 22,552 |
| 2014 | 535,332 | 694,680 | 22,874 | 16,697,152 | 713,443 | 23,492 |
| 2015 | 534,474 | 726,895 | 22,780 | 17,494,741 | 745,634 | 23,367 |
| 2016 | 543,002 | 746,526 | 23,091 | 18,006,409 | 765,711 | 23,684 |
| 2017 | 591,734 | 764,678 | 25,121 | 18,459,748 | 783,670 | 25,745 |
| 2018 | 610,744 | 781,169 | 25,901 | 18,868,140 | 800,173 | 26,531 |
| 2019 | 613,453 | 804,123 | 25,998 | 19,529,545 | 827,662 | 26,759 |
| 2020 | 676,935 | 849,105 | 28,705 | 20,682,033 | 877,020 | 29,649 |
| 2021 | 777,062 | 927,776 | 33,111 | 22,348,883 | 952,302 | 33,987 |
| 2022 | 765,529 | 978,579 | 32,827 | 23,516,012 | 1,008,406 | 33,828 |
| 2023 | 757,276 | 1,010,890 | 32,442 | 24,384,813 | 1,044,651 | 33,525 |
| 2024 | 796,904 | 1,093,213 | 34,040 | 26,494,656 | 1,131,734 | 35,241 |
Source: Statistical Yearbook of the ROC 2022, 2023, 2024 (GDP, GNI: table 39; per capita GDP, GNI: table 40)
TOP HOME [◆ Statistics] [Economics/trade]
Please note that the Directorate-General of Budget, Accounting and Statistics (DGBAS) offers detailed GDP data on its national statistics database (English / Chinese), the Chinese page from 1951 onward and the English page from 1961 onward. Listed categories include the following:
| English | Chinese (without Hanyu Pinyin) |
|---|---|
| Period | 統計期 |
| Population (Mid-Year, Persons) | 期中人口(人) |
| Exchange Rate (NT$ per US$) | 平均匯率(元/美元) |
| GDP Growth Rate (%) | 經濟成長率(%) |
| GDP (Million NT$, at Current Prices) | 國內生產毛額 GDP(名目值,百萬元) |
| GDP (Million US$, at Current Prices) | 國內生產毛額 GDP(名目值,百萬美元) |
| Per Capita GDP (NT$, at Current Prices) | 平均每人 GDP(名目值,元) |
| Per Capita GDP (US$, at Current Prices) | 平均每人 GDP(名目值,美元) |
| GNI (Million NT$, at Current Prices) | 國民所得毛額 GNI(名目值,百萬元) |
| GNI (Million US$, at Current Prices) | 國民所得毛額 GNI(名目值,百萬美元) |
| Per Capita GNI (NT$, at Current Prices) | 平均每人 GNI(名目值,元) |
| Per Capita GNI (US$, at Current Prices) | 平均每人 GNI(名目值,美元) |
| NI (Million NT$, at Current Prices) | 國民所得(名目值,百萬元) |
| NI (Million US$, at Current Prices) | 國民所得(名目值,百萬美元) |
| Per Capita NI (NT$, at Current Prices) | 平均每人所得(名目值,元) |
| Per Capita NI (US$, at Current Prices) | 平均每人所得(名目值,美元) |
"GNI" stands for gross national income, "NI" for national income. For information about the defense expenditures of the ROC in relation to the GDP click here.
TOP HOME [◆ Statistics] [Economics/trade]
Percentage of economic sectors in GDP
| Period/ year |
Structure of production (% of GDP by industry) | ||
|---|---|---|---|
| AGRICULTURE | INDUSTRY (Manufacturing) | SERVICES | |
| 2007 | 1.45 | 32.10 (27.63) | 65.15 |
| 2008 | 1.55 | 30.50 (26.65) | 66.75 |
| 2009 | 1.68 | 30.69 (25.96) | 66.38 |
| 2010 | 1.61 | 33.30 (28.60) | 64.83 |
| 2011 | 1.74 | 32.62 (28.27) | 65.64 |
| 2012 | 1.70 | 32.66 (28.33) | 65.64 |
| 2013 | 1.73 | 33.72 (29.12) | 64.54 |
| 2014 | 1.85 | 35.57 (30.94) | 62.57 |
| 2015 | 1.76 | 36.29 (31.42) | 61.95 |
| 2016 | 1.87 | 36.87 (32.22) | 61.27 |
| 2017 | 1.83 | 37.23 (32.97) | 60.94 |
| 2018 | 1.70 | 37.12 (33.02) | 61.18 |
| 2019 | 1.70 | 36.63 (32.23) | 61.67 |
| 2020 | 1.60 | 39.01 (34.12) | 59.39 |
| 2021 | 1.45 | 40.78 (36.37) | 57.77 |
| 2022 | 1.41 | 39.55 (36.63) | 59.04 |
| 2023 | 1.51 | 38.58 (34.67) | 59.91 |
| 2024 | 1.47 | 39.78 (35.23) | 58.75 |
Data provided by the Chung-Hua Institution for Economic Research (CIER)
TOP HOME [◆ Statistics] [Economics/trade]
Exports and imports
[Unit—million US$]
| Year | Exports | Imports | Balance | Year | Exports | Imports | Balance | |
|---|---|---|---|---|---|---|---|---|
| 1980 | 19,811 | 19,733 | 77 | 2015 | 284,434 | 236,380 | 48,053 | |
| 1985 | 30,726 | 20,102 | 10,624 | 2016 | 279,175 | 229,199 | 49,975 | |
| 1990 | 67,214 | 54,716 | 12,498 | 2017 | 315,487 | 257,200 | 58,287 | |
| 1995 | 113,342 | 104,012 | 9,330 | 2018 | 334,007 | 284,792 | 49,216 | |
| 2000 | 151,950 | 140,732 | 11,218 | 2019 | 329,157 | 285,651 | 43,506 | |
| 2005 | 198,432 | 182,614 | 15,817 | 2020 | 345,126 | 286,148 | 58,978 | |
| 2010 | 277,352 | 255,746 | 21,606 | 2021 | 446,371 | 381,958 | 64,414 | |
| 2011 | 312,182 | 287,316 | 24,866 | 2022 | 479,415 | 428,083 | 51,333 | |
| 2012 | 305,315 | 276,466 | 28,848 | 2023 | 432,420 | 351,632 | 80,788 | |
| 2013 | 310,866 | 277,384 | 33,481 | 2024 | 474,996 | 394,365 | 80,630 | |
| 2014 | 319,413 | 281,096 | 38,318 | |||||
Sources: Statistical Yearbooks of the ROC—2006 (table 119); 2021, 2022 (table 53), 2023 (table 54), 2024 (table 52), using data from the MOF
TOP HOME [◆ Statistics] [Economics/trade]
Inflation
| Year | CPI change | Year | CPI change | Year | CPI change | ||
|---|---|---|---|---|---|---|---|
| 1960 | 18.5 % | 2005 | 2.31 % | 2018 | 1.36 % | ||
| 1965 | – 0.07 % | 2010 | 0.97 % | 2019 | 0.55 % | ||
| 1970 | 3.58 % | 2011 | 1.42 % | 2020 | – 0.23 % | ||
| 1975 | 5.24 % | 2012 | 1.93 % | 2021 | 1.97 % | ||
| 1980 | 19.0 % | 2013 | 0.79 % | 2022 | 2.95 % | ||
| 1985 | – 0.17 % | 2014 | 1.20 % | 2023 | 2.49 % | ||
| 1990 | 4.12 % | 2015 | – 0.31 % | 2024 | 2.10 % | ||
| 1995 | 3.66 % | 2016 | 1.40 % | ||||
| 2000 | 1.26 % | 2017 | 0.62 % | ||||
Data on the annual change of Consumer Price Indices in Taiwan Area come from the DGBAS's website "National Statistics". The MOF offers figures about public finance and trade statistics; click here.
TOP HOME [◆ Statistics] [Economics/trade]
Unemployment rate
| Year | Unemployment | Year | Unemployment | Year | Unemployment | ||
|---|---|---|---|---|---|---|---|
| 1952 | 4.5 % | 2005 | 4.13 % | 2016 | 3.92 % | ||
| 1971 | 1.7 % | 2006 | 3.91 % | 2017 | 3.76 % | ||
| 1981 | 1.4 % | 2007 | 3.91 % | 2018 | 3.71 % | ||
| 1991 | 1.51 % | 2008 | 4.14 % | 2019 | 3.73 % | ||
| 1996 | 2.60 % | 2009 | 5.85 % | 2020 | 3.85 % | ||
| 1999 | 2.92 % | 2010 | 5.21 % | 2021 | 3.95 % | ||
| 2000 | 2.99 % | 2011 | 4.39 % | 2022 | 3.67 % | ||
| 2001 | 4.57 % | 2012 | 4.24 % | 2023 | 3.48 % | ||
| 2002 | 5.17 % | 2013 | 4.18 % | 2024 | 3.38 % | ||
| 2003 | 4.99 % | 2014 | 3.96 % | 2025 | 3.35 % | ||
| 2004 | 4.44 % | 2015 | 3.78 % | ||||
Sources: Statistical Yearbook of the ROC 2021, 2023 (table 7), MOL figures about labor status
More labor statistics can be found on the website of the MOL, links see below.
MOL statistics—yearly bulletin
Major economic indicators, click here
or here.
TOP HOME [◆ Statistics] [Economics/trade]
For comparison, the tables directly below shows data from the NDC's
Taiwan Statistical Data Book 2019 (GDP, per capita GNI, economic growth, change CPI: table 1-1a; total GNI: table 3-1;
structure of production: table 3-8b; exports, imports, trade balance, unemployment rate: table 1-1c).
| Period/ year |
Total GDP (US$ million) |
Per capita GDP | Total GNI (NT$ million) |
Per capita GNI | ||
|---|---|---|---|---|---|---|
| (NT$) | (US$) | (NT$) | (US$) | |||
| 1952 | 1,711 | 2,190 | 213 | 17,271 | 2,146 | 208 |
| 1955 | 1,940 | 3,364 | 216 | 30,160 | 3,363 | 216 |
| 1960 | 1,743 | 5,943 | 163 | 63,371 | 5,940 | 163 |
| 1965 | 2,869 | 9,173 | 229 | 114,577 | 9,157 | 229 |
| 1970 | 5,786 | 15,870 | 397 | 231,015 | 15,841 | 396 |
| 1975 | 15,838 | 37,438 | 985 | 598,483 | 37,230 | 980 |
| 1980 | 42,295 | 86,002 | 2,389 | 1,520,519 | 85,883 | 2,386 |
| 1985 | 63,623 | 132,142 | 3,315 | 2,583,166 | 134,599 | 3,377 |
| 1990 | 166,615 | 220,933 | 8,216 | 4,597,595 | 226,718 | 8,431 |
| 1995 | 279,224 | 347,789 | 13,129 | 7,507,569 | 353,004 | 13,326 |
| 2000 | 331,452 | 466,598 | 14,941 | 10,490,818 | 472,889 | 15,142 |
| 2005 | 375,769 | 532,001 | 16,532 | 12,383,120 | 544,798 | 16,930 |
| 2010 | 446,105 | 610,140 | 19,278 | 14,548,852 | 628,706 | 19,864 |
| 2011 | 485,653 | 617,078 | 20,939 | 14,700,572 | 633,822 | 21,507 |
| 2012 | 495,845 | 631,142 | 21,308 | 15,141,108 | 650,660 | 21,967 |
| 2013 | 511,614 | 652,429 | 21,916 | 15,654,588 | 670,585 | 22,526 |
| 2014 | 530,519 | 688,434 | 22,668 | 16,582,405 | 708,540 | 23,330 |
| 2015 | 525,562 | 714,774 | 22,400 | 17,301,397 | 737,393 | 23,109 |
| 2016 | 531,281 | 730,411 | 22,592 | 17,705,994 | 752,936 | 23,289 |
| 2017 | 574,940 | 742,976 | 24,408 | 17,965,345 | 762,681 | 25,055 |
| 2018 | 589,997 | 754,711 | 25,026 | 18,129,011 | 768,959 | 25,501 |
Note: Total GDP in US$ and GNI in NT$ million at current prices.
| Period/ year |
Structure of production (% of GDP by industry) | ||
|---|---|---|---|
| AGRICULTURE | INDUSTRY (Manufacturing) | SERVICES | |
| 1952 | 32.2 | 19.7 (12.9) | 48.1 |
| 1955 | 29.1 | 23.2 (15.6) | 47.7 |
| 1960 | 28.5 | 26.9 (19.1) | 44.6 |
| 1965 | 23.6 | 30.2 (22.3) | 46.2 |
| 1970 | 15.5 | 36.8 (29.2) | 47.7 |
| 1975 | 12.7 | 39.9 (30.9) | 47.4 |
| 1980 | 7.7 | 45.7 (36.0) | 46.6 |
| 1985 | 5.7 | 44.6 (34.9) | 49.7 |
| 1990 | 4.0 | 39.3 (31.2) | 56.7 |
| 1995 | 3.3 | 33.7 (25.6) | 63.0 |
| 2000 | 2.0 | 31.3 (25.6) | 66.7 |
| 2005 | 1.6 | 32.3 (27.8) | 66.1 |
| 2010 | 1.6 | 33.8 (29.1) | 64.6 |
| 2011 | 1.7 | 33.0 (28.7) | 65.3 |
| 2012 | 1.7 | 32.8 (28.4) | 65.6 |
| 2013 | 1.7 | 33.5 (28.8) | 64.9 |
| 2014 | 1.8 | 34.8 (30.0) | 63.4 |
| 2015 | 1.7 | 35.3 (30.2) | 63.0 |
| 2016 | 1.8 | 35.5 (30.7) | 62.7 |
| 2017 | 1.8 | 35.5 (31.0) | 62.7 |
| 2018 | 1.6 | 35.2 (30.8) | 63.2 |
Note: Source for the figures 1952 through 1980—Taiwan Statistical Data Book 2004 (at market prices, see table 1-1b).
| Year | Exports (US$ million) |
Imports (US$ million) |
Trade balance (US$ million) |
|---|---|---|---|
| 1952 | 116 | 187 | – 71 |
| 1955 | 123 | 201 | – 78 |
| 1960 | 164 | 297 | – 133 |
| 1965 | 450 | 556 | – 106 |
| 1970 | 1,481 | 1,524 | – 43 |
| 1975 | 5,309 | 5,952 | – 643 |
| 1980 | 19,811 | 19,733 | + 77 |
| 1985 | 30,726 | 20,102 | + 10,624 |
| 1990 | 67,214 | 54,716 | + 12,498 |
| 1995 | 113,342 | 104,012 | + 9,330 |
| 2000 | 151,950 | 140,732 | + 11,218 |
| 2005 | 199,761 | 185,438 | + 14,323 |
| 2010 | 278,008 | 256,274 | + 21,734 |
| 2011 | 312,923 | 288,062 | + 24,861 |
| 2012 | 306,409 | 277,324 | + 29,085 |
| 2013 | 311,428 | 278,010 | + 33,418 |
| 2014 | 320,092 | 281,850 | + 38,242 |
| 2015 | 285,344 | 237,219 | + 48,124 |
| 2016 | 280,321 | 230,568 | + 49,753 |
| 2017 | 317,249 | 259,266 | + 57,983 |
| 2018 | 335,909 | 286,333 | + 49,576 |
Note: Exports at f.o.b. prices, imports at c.i.f. prices.
| Period/ year |
Economic growth rate (%) | Change CPI (%) | Unemployment rate (%) |
|---|---|---|---|
| 1952 | 11.8 | N/A | 4.37 |
| 1955 | 7.7 | N/A | 3.81 |
| 1960 | 7.2 | 18.6 | 3.98 |
| 1965 | 11.9 | – 0.1 | 3.29 |
| 1970 | 11.5 | 3.6 | 1.70 |
| 1975 | 6.2 | 5.2 | 2.40 |
| 1980 | 8.0 | 19.0 | 1.23 |
| 1985 | 4.8 | – 0.2 | 2.91 |
| 1990 | 5.7 | 4.1 | 1.67 |
| 1995 | 6.5 | 3.7 | 1.79 |
| 2000 | 6.4 | 1.3 | 2.99 |
| 2005 | 5.4 | 2.3 | 4.13 |
| 2010 | 10.6 | 1.0 | 5.21 |
| 2011 | 3.8 | 1.4 | 4.39 |
| 2012 | 2.1 | 1.9 | 4.24 |
| 2013 | 2.2 | 0.8 | 4.18 |
| 2014 | 4.0 | 1.2 | 3.96 |
| 2015 | 0.8 | – 0.3 | 3.78 |
| 2016 | 1.5 | 1.4 | 3.92 |
| 2017 | 3.1 | 0.6 | 3.76 |
| 2018 | 2.6 | 1.4 | 3.71 |
Note: Economic growth rate at 2011 prices, for 1952 at 2006 prices.
TOP HOME [◆ Statistics] [Economics/trade]
Financial statistics
The financial statistics shown here include recent data on the following tables:
● Government revenues and expenditures
● Foreign exchange reserves since 1961
● Annual currency exchange rates since 1993
● Annual average prices (US$) for crude oil and fine gold since 1978
Main source for the financial statistics shown here is the DGBAS's Statistical Yearbook of the ROC 2020. For public finance and trade statistics of the MOF click here. Statistics of the ROC Central Bank can be found here. For monthly data concerning the Taiwan Stock Exchange index (TAIEX) click here.
Government revenues and expenditures
| Fiscal year | Revenues (million NT$) |
Expenditures (million NT$) |
Fiscal year | Revenues (million NT$) |
Expenditures (million NT$) |
|
|---|---|---|---|---|---|---|
| 1976 | 156,124 | 146,594 | 2010 | 2,115,554 | 2,566,804 | |
| 1981 | 411,712 | 425,731 | 2011 | 2,306,173 | 2,612,947 | |
| 1986 | 584,838 | 616,718 | 2012 | 2,321,205 | 2,677,984 | |
| 1991 | 1,049,931 | 1,275,613 | 2013 | 2,457,632 | 2,665,241 | |
| 1996 | 1,604,184 | 1,843,786 | 2014 | 2,508,815 | 2,645,712 | |
| 1999 | 2,004,394 | 2,050,004 | 2015 | 2,662,328 | 2,645,189 | |
| 2000 | 2,784,863 | 3,140,936 | 2016 | 2,690,918 | 2,745,305 | |
| 2001 | 1,896,841 | 2,271,755 | 2017 | 2,753,329 | 2,778,361 | |
| 2002 | 1,787,919 | 2,144,994 | 2018 | 2,848,611 | 2,845,491 | |
| 2003 | 1,948,847 | 2,216,514 | 2019 | 2,931,855 | 2,911,648 | |
| 2004 | 1,927,400 | 2,245,047 | 2020 | 3,036,132 | 3,241,989 | |
| 2005 | 2,218,039 | 2,291,999 | 2021 | 3,321,122 | 3,360,265 | |
| 2006 | 2,177,018 | 2,214,226 | 2022 | 3,690,710 | 3,652,373 | |
| 2007 | 2,244,758 | 2,214,226 | 2023 | 3,888,797 | 4,033,626 | |
| 2008 | 2,231,614 | 2,290,169 | 2024 | 4,184,951 | 4,074,169 | |
| 2009 | 2,113,644 | 2,670,898 | ||||
Source: Statistical Yearbook of the ROC 2021, 2022 (revenues: table 90, expenditures: table 91), 2023, 2024 (revenues: table 89, expenditures: table 90), using data from the MOF, National Audit Office
For information about the defense expenditures of the ROC in relation to total government expenditures click here.
TOP HOME [◆ Statistics] [Finance]
Foreign exchange reserves since 1961
| Year | Amount | Year | Amount | Year | Amount | Year | Amount | |||
|---|---|---|---|---|---|---|---|---|---|---|
| 1961 | 93 | 1978 | 1,406 | 1995 | 90,310 | 2012 | 403,169 | |||
| 1962 | 71 | 1979 | 1,392 | 1996 | 88,038 | 2013 | 416,811 | |||
| 1963 | 177 | 1980 | 2,205 | 1997 | 83,502 | 2014 | 418,980 | |||
| 1964 | 242 | 1981 | 7,235 | 1998 | 90,341 | 2015 | 426,031 | |||
| 1965 | 245 | 1982 | 8,532 | 1999 | 106,200 | 2016 | 434,204 | |||
| 1966 | 275 | 1983 | 11,859 | 2000 | 106,742 | 2017 | 451,500 | |||
| 1967 | 335 | 1984 | 15,664 | 2001 | 122,211 | 2018 | 461,784 | |||
| 1968 | 300 | 1985 | 22,556 | 2002 | 161,656 | 2019 | 478,126 | |||
| 1969 | 395 | 1986 | 46,310 | 2003 | 206,632 | 2020 | 529,911 | |||
| 1970 | 482 | 1987 | 76,748 | 2004 | 241,738 | 2021 | 548,408 | |||
| 1971 | 439 | 1988 | 73,897 | 2005 | 253,290 | 2022 | 554,932 | |||
| 1972 | 651 | 1989 | 73,224 | 2006 | 266,148 | 2023 | 570,595 | |||
| 1973 | 1,026 | 1990 | 72,441 | 2007 | 270,311 | 2024 | 576,677 | |||
| 1974 | 1,055 | 1991 | 82,405 | 2008 | 291,707 | 2025 | 602,553 | |||
| 1975 | 1,074 | 1992 | 82,306 | 2009 | 348,198 | |||||
| 1976 | 1,516 | 1993 | 83,573 | 2010 | 382,005 | |||||
| 1977 | 1,345 | 1994 | 92,454 | 2011 | 385,547 | |||||
Note: Foreign exchange reserves figures for December of the listed year, provided by the ROC Central Bank. (Unit: million US$)
TOP HOME [◆ Statistics] [Finance]
Annual currency exchange rates since 1993
| 1 US$ = NT$... | 1 Euro (€) = NT$... | ||||||
|---|---|---|---|---|---|---|---|
| Year | Low | Average | High | Low | Average | High | |
| 1993 | 25.820 | 26.80743 | 26.930 | — | — | — | |
| 1994 | 25.920 | 26.46244 | 27.150 | — | — | — | |
| 1995 | 25.010 | 26.49397 | 27.497 | — | — | — | |
| 1996 | 27.060 | 27.46026 | 27.960 | — | — | — | |
| 1997 | 26.550 | 28.71918 | 33.481 | — | — | — | |
| 1998 | 31.750 | 33.49656 | 35.200 | — | — | — | |
| 1999 | 30.000 | 32.31913 | 33.290 | 31.6506 | 34.48378 | 38.0808 | |
| 2000 | 30.200 | 31.26272 | 33.188 | 26.5582 | 28.89330 | 32.2497 | |
| 2001 | 32.070 | 33.98527 | 36.188 | 28.6633 | 30.46173 | 33.6050 | |
| 2002 | 31.332 | 34.58156 | 36.710 | 30.0432 | 32.69697 | 36.6486 | |
| 2003 | 33.460 | 34.48082 | 35.010 | 36.1088 | 39.02490 | 42.8319 | |
| 2004 | 31.532 | 33.46888 | 35.311 | 39.0600 | 41.61540 | 43.7138 | |
| 2005 | 30.720 | 32.19914 | 33.780 | 37.8018 | 40.06741 | 43.3937 | |
| 2006 | 31.250 | 32.55646 | 33.350 | 38.4480 | 40.90074 | 43.1822 | |
| 2007 | 32.172 | 32.88258 | 33.500 | 42.3091 | 45.06189 | 48.1300 | |
| 2008 | 29.979 | 31.55586 | 33.610 | 41.4447 | 46.32524 | 48.8477 | |
| 2009 | 31.763 | 33.06652 | 35.170 | 43.1330 | 46.06811 | 48.6842 | |
| 2010 | 29.040 | 31.55146 | 32.528 | 38.7263 | 41.88182 | 46.1335 | |
| 2011 | 28.1430 | 29.51258 | 30.4925 | 37.7585 | 41.08356 | 42.7075 | |
| 2012 | 28.4733 | 29.66223 | 30.1300 | 36.0308 | 38.14149 | 39.7009 | |
| 2013 | 28.9167 | 29.75442 | 30.0667 | 37.6699 | 39.51745 | 41.1673 | |
| 2014 | 29.7767 | 30.35176 | 31.7033 | 38.1307 | 40.33046 | 42.2859 | |
| 2015 | 30.4546 | 31.7827 | 33.1976 | 33.0925 | 35.2764 | 38.3012 | |
| 2016 | 31.1525 | 32.2562 | 33.7260 | 33.2164 | 35.6998 | 37.5464 | |
| 2017 | 29.6643 | 30.4252 | 32.4460 | 32.1844 | 34.3745 | 36.1563 | |
| 2018 | 28.9572 | 30.1316 | 31.1025 | 34.6139 | 35.5660 | 36.6049 | |
| 2019 | 29.9460 | 30.8869 | 31.7270 | 33.3703 | 34.5894 | 35.6126 | |
| 2020 | 27.9330 | 29.4428 | 30.4020 | 32.2843 | 33.5964 | 35.0919 | |
| 2021 | 27.5474 | 27.9157 | 28.6089 | 31.1233 | 33.0251 | 34.5816 | |
| 2022 | 27.4363 | 29.7834 | 32.2987 | 29.9735 | 31.3260 | 32.8894 | |
| 2023 | 29.7149 | 31.1480 | 32.4797 | 32.1875 | 33.7113 | 34.9841 | |
| 2024 | 30.6848 | 32.1009 | 32.8464 | 33.5860 | 34.7373 | 35.8413 | |
| 2025 | 28.9263 | 31.1669 | 33.2603 | 33.0176 | 35.1889 | 37.3887 | |
Sources: All figures 1993–2014 by Oanda.com (interbank rate); figures since 2015 by Exchange Rates UK. For foreign exchange rates of the day click here.


TOP HOME [◆ Statistics] [Finance]
Annual average prices (US$) for crude oil and fine gold since 1978
| Year | Oil | Gold | Year | Oil | Gold | Year | Oil | Gold |
|---|---|---|---|---|---|---|---|---|
| 1978 | 9.00 | 196.80 | 1994 | 13.19 | 384.64 | 2010 | 74.71 | 1,230.75 |
| 1979 | 12.64 | 320.98 | 1995 | 14.62 | 383.76 | 2011 | 95.73 | 1,567.96 |
| 1980 | 21.59 | 607.76 | 1996 | 18.46 | 386.25 | 2012 | 94.52 | 1,679.83 |
| 1981 | 31.77 | 449.58 | 1997 | 17.23 | 329.33 | 2013 | 96.13 | 1,399.56 |
| 1982 | 28.52 | 376.11 | 1998 | 10.87 | 294.19 | 2014 | 87.39 | 1,256.25 |
| 1983 | 26.19 | 419.40 | 1999 | 15.56 | 280.60 | 2015 | 44.39 | 1,151.95 |
| 1984 | 25.88 | 358.12 | 2000 | 26.72 | 276.68 | 2016 | 38.29 | 1,249.98 |
| 1985 | 24.09 | 320.83 | 2001 | 21.84 | 271.13 | 2017 | 48.05 | 1,269.34 |
| 1986 | 12.51 | 368.23 | 2002 | 22.51 | 312.86 | 2018 | 61.40 | 1,265.60 |
| 1987 | 15.40 | 451.09 | 2003 | 27.56 | 367.63 | 2019 | 55.59 | 1,405.33 |
| 1988 | 12.58 | 432.21 | 2004 | 36.77 | 409.81 | 2020 | 36.86 | 1,784.66 |
| 1989 | 15.86 | 380.12 | 2005 | 50.28 | 448.98 | 2021 | 65.84 | 1,792.73 |
| 1990 | 20.03 | 383.90 | 2006 | 59.69 | 611.54 | 2022 | 93.97 | 1,798.96 |
| 1991 | 16.54 | 358.94 | 2007 | 66.52 | 704.68 | 2023 | 76.10 | 1,953.69 |
| 1992 | 15.99 | 343.23 | 2008 | 94.04 | 880.21 | 2024 | 74.52 | 2,404.58 |
| 1993 | 14.25 | 363.95 | 2009 | 56.39 | 982.65 | 2025 | 63.40 | 3,472.54 |
Note: The oil prices are listed in US$ per barrel (42 gallons = 158.98 l) as crude oil prices (domestic first purchase prices), source: Energy Information Administration, i. e. official energy statistics from the US government. The gold prices are listed in US$ per troy ounce (31.1 g), source: Macrotrends.net.
TOP HOME [◆ Statistics] [Finance]
For comparison, the table directly below shows data from the NDC's
Taiwan Statistical Data Book 2019 (table 9-1a).
| Fiscal year | Govt. revenues (NT$ million) ① |
Govt. expenditures (NT$ million) ② |
Surplus/deficit (NT$ million) ③ |
|---|---|---|---|
| 1955 | 6,077 | 6,414 | N/A |
| 1960 | 11,699 | 12,080 | N/A |
| 1965 | 22,146 | 22,387 | N/A |
| 1970 | 46,586 | 35,901 | 1,061 |
| 1975 | 123,238 | 82,915 | 2,753 |
| 1980 | 327,649 | 213,738 | 352 |
| 1985 | 531,075 | 382,713 | – 3,735 |
| 1990 | 1,053,410 | 702,812 | – 5,116 |
| 1995 | 1,522,624 | 1,328,425 | – 350,637 |
| 2000 | 2,679,563 | 2,529,683 | – 356,074 |
| 2002 | 1,706,602 | 1,649,952 | – 357,075 |
| 2004 | 1,845,279 | 1,703,657 | – 317,647 |
| 2006 | 2,094,023 | 1,754,091 | – 37,208 |
| 2008 | 2,181,188 | 1,811,308 | – 111,972 |
| 2010 | 2,062,022 | 1,911,511 | – 451,251 |
| 2011 | 2,238,905 | 2,020,023 | – 306,774 |
| 2012 | 2,259,104 | 2,179,796 | – 356,779 |
| 2013 | 2,370,392 | 2,166,627 | – 207,609 |
| 2014 | 2,416,204 | 2,191,528 | – 136,897 |
| 2015 | 2,592,406 | 2,216,782 | 17,139 |
| 2016 | 2,642,536 | 2,292,303 | – 54,388 |
| 2017 | 2,718,248 | 2,283,605 | – 25,032 |
| 2018 | 2,810,017 | 2,295,207 | 4,450 |
Note: Column 1 (①) shows total net government revenues of all levels, column 2 (②) total net government expenditures of all levels, column 3 (③) total surplus or deficit of current account and capital account combined. Before 2000, the fiscal year (FY) begins July 1 of the preceding year and ends June 30. FY 2000 extends from July 1, 1999 to Dec. 31, 2000; subsequent FYs follow the calendar year (from Jan. 1 to Dec. 31). Figures for 1955–1965 from the Taiwan Statistical Data Book 2013 (revenues: table 9-2a, expenditures: table 9-3a).
TOP HOME [◆ Statistics] [Finance]
Energy statistics
The energy statistics shown here include recent data on the following tables:
● Power generation
● Domestic power consumption
Main sources for the energy statistics below are the annual Energy Statistics Handbooks published by the MOEA's Energy Administration (EA). In addition to the flipbook editions on the EA website, the handbooks can also be viewed in PDF format.
| Energy Statistics Handbook (flipbook) | Energy Statistics Handbook (PDF) |
|---|---|
For the EA's energy statistical annual reports click here. Taiwan's main electricity provider is Taiwan Power Company (Taiwan dianli gongsi 台灣電力公司, abbrev. Taidian 台電 in Chinese and Taipower in English).
Power generation
———OVERVIEW———
| Year | Total (GWh) |
Pumped Hydro GWh (%) |
Coal-fired GWh (%) |
Oil-fired GWh (%) |
LNG fired GWh (%) |
Nuclear GWh (%) |
Renewables GWh (%) |
|---|---|---|---|---|---|---|---|
| 2000 | 184,841 | 4,310 (2.33 %) |
87,044 (47.09 %) |
30,971 (16.76 %) |
17,658 (9.55 %) |
38,503 (20.83 %) |
6,354 (3.44 %) |
| 2005 | 227,512.3 | 3,838.5 (1.69 %) |
120,044.2 (52.76 %) |
17,200.8 (7.56 %) |
38,915.7 (17.10 %) |
39,972.0 (17.57 %) |
7,540.9 (3.31 %) |
| 2010 | 247,058.9 | 3,061.0 (1.24 %) |
122,352.7 (49.52 %) |
11,130.8 (4.51 %) |
60,245.8 (24.39 %) |
41,628.7 (16.85 %) |
8,639.8 (3.50 %) |
| 2011 | 252,167.0 | 2,902.1 (1.15 %) |
124,468.0 (49.36 %) |
9,487.8 (3.76 %) |
64,205.6 (25.46 %) |
42,116.5 (16.70 %) |
8,987.1 (3.56 %) |
| 2012 | 250,373.4 | 2,936.9 (1.17 %) |
122,436.8 (48.90 %) |
7,623.2 (3.04 %) |
66,292.1 (26.48 %) |
40,421.7 (16.14 %) |
10,662.7 (4.26 %) |
| 2013 | 252,340.8 | 3,187.1 (1.26 %) |
121,449.1 (48.13 %) |
6,818.1 (2.70 %) |
68,389.0 (27.10 %) |
41,639.4 (16.50 %) |
10,858.1 (4.30 %) |
| 2014 | 259,963.9 | 3,121.2 (1.20 %) |
123,444.7 (47.49 %) |
8,013.9 (3.08 %) |
73,070.2 (28.11 %) |
42,389.0 (16.31 %) |
9,925.1 (3.82 %) |
| 2015 | 258,141.9 | 3,035.0 (1.18 %) |
117,158.8 (45.39 %) |
11,989.2 (4.64 %) |
79,009.0 (30.61 %) |
36,471.1 (14.13 %) |
10,478.8 (4.06 %) |
| 2016 | 264,107.7 | 3,293.7 (1.25 %) |
121,225.0 (45.90 %) |
11,891.3 (4.50 %) |
83,303.6 (31.54 %) |
31,661.4 (11.99 %) |
12,732.8 (4.82 %) |
| 2017 | 270,256.4 | 3,333.7 (1.23 %) |
127,949.5 (47.34 %) |
12,716.7 (4.71 %) |
91,441.7 (33.84 %) |
22,445.5 (8.31 %) |
12,369.3 (4.58 %) |
| 2018 | 275,539.2 | 3,370.8 (1.22 %) |
131,256.7 (47.64 %) |
8,171.4 (2.97 %) |
92,409.0 (33.54 %) |
27,678.3 (10.05 %) |
12,653.0 (4.59 %) |
| 2019 | 274,193.6 | 3,208.1 (1.17 %) |
126,400.8 (46.10 %) |
5,849.6 (2.13 %) |
91,145.5 (33.24 %) |
32,323.4 (11.79 %) |
15,266.2 (5.57 %) |
| 2020 | 279,999.6 | 3,158.9 (1.13 %) |
125,907.4 (44.97 %) |
4,419.6 (1.58 %) |
99,887.3 (35.67 %) |
31,440.2 (11.23 %) |
15,186.1 (5.42 %) |
| 2021 | 291,033.2 | 3,184.0 (1.09 %) |
128,840.4 (44.27 %) |
5,331.1 (1.83 %) |
108,358.8 (37.23 %) |
27,787.9 (9.55 %) |
17,530.9 (6.02 %) |
| 2022 | 288,184.8 | 3,062.2 (1.06 %) |
121,028.6 (42.00 %) |
4,449.5 (1.54 %) |
112,005.9 (38.87 %) |
23,754.8 (8.24 %) |
23,883.7 (8.29 %) |
| 2023 | 282,427.7 | 3,051.1 (1.08 %) |
119,173.4 (42.20 %) |
3,776.1 (1.34 %) |
111,629.6 (39.53 %) |
17,802.0 (6.30 %) |
26,995.4 (9.56 %) |
| 2024 | 289,173.4 | 3,075.3 (1.06 %) |
113,315.5 (39.19 %) |
4,182.2 (1.45 %) |
122,503.4 (42.36 %) |
12,180.3 (4.21 %) |
33,916.6 (11.73 %) |
[Units—GWh and percentage]
———DETAILS ON RENEWABLE ENERGY———
| Year | Subtotal GWh (%) |
Conv. Hydro GWh (%) |
Geothermal GWh (%) |
Photovoltaic GWh (%) |
Wind GWh (%) |
Biomass GWh (%) |
Waste GWh (%) |
|---|---|---|---|---|---|---|---|
| 2000 | 6,354 (3.44 %) |
4,560 (2.47 %) |
— | 0 (0.00 %) |
1 (0.00 %) |
302 (0.16 %) |
1,491 (0.81 %) |
| 2005 | 7,540.9 (3.31 %) |
4,071.4 (1.79 %) |
— | 1.0 (0.00 %) |
91.3 (0.04 %) |
323.5 (0.14 %) |
3,053.8 (1.34 %) |
| 2010 | 8,639.8 (3.50 %) |
4,194.1 (1.70 %) |
— | 21.7 (0.01 %) |
1,026.3 (0.42 %) |
270.0 (0.11 %) |
3,127.6 (1.27 %) |
| 2011 | 8,987.1 (3.56 %) |
3,999.7 (1.59 %) |
— | 61.6 (0.02 %) |
1,492.7 (0.59 %) |
236.1 (0.09 %) |
3,196.9 (1.27 %) |
| 2012 | 10,662.7 (4.26 %) |
5,669.6 (2.26 %) |
— | 159.9 (0.06 %) |
1,413.5 (0.56 %) |
242.1 (0.10 %) |
3,177.7 (1.27 %) |
| 2013 | 10,858.1 (4.30 %) |
5,422.9 (2.15 %) |
— | 321.1 (0.13 %) |
1,640.0 (0.65 %) |
228.5 (0.09 %) |
3,245.7 (1.29 %) |
| 2014 | 9,925.1 (3.82 %) |
4,317.9 (1.66 %) |
— | 528.8 (0.20 %) |
1,500.5 (0.58 %) |
252.5 (0.10 %) |
3,325.5 (1.28 %) |
| 2015 | 10,478.8 (4.06 %) |
4,470.1 (1.73 %) |
— | 850.3 (0.33 %) |
1,525.2 (0.59 %) |
249.0 (0.10 %) |
3,384.2 (1.31 %) |
| 2016 | 12,732.8 (4.82 %) |
6,562.0 (2.48 %) |
— | 1,109.0 (0.42 %) |
1,457.1 (0.55 %) |
208.1 (0.08 %) |
3,396.6 (1.29 %) |
| 2017 | 12,369.3 (4.58 %) |
5,446.8 (2.02 %) |
— | 1,667.5 (0.62 %) |
1,722.5 (0.64 %) |
191.6 (0.07 %) |
3,341.0 (1.24 %) |
| 2018 | 12,653.0 (4.59 %) |
4,481.6 (1.63 %) |
0.0 (0.00 %) |
2,703.7 (0.98 %) |
1,709.5 (0.62 %) |
191.6 (0.07 %) |
3,566.6 (1.29 %) |
| 2019 | 15,266.2 (5.57 %) |
5,544.8 (2.02 %) |
0.8 (0.00 %) |
4,017.0 (1.47 %) |
1,892.2 (0.69 %) |
176.5 (0.06 %) |
3,634.9 (1.33 %) |
| 2020 | 15,186.1 (5.42 %) |
3,019.2 (1.08 %) |
1.9 (0.00 %) |
6,074.7 (2.17 %) |
2,308.9 (0.82 %) |
211.8 (0.08 %) |
3,569.7 (1.27 %) |
| 2021 | 17,530.9 (6.02 %) |
3,474.7 (1.19 %) |
9.1 (0.00 %) |
7,970.2 (2.74 %) |
2,270.8 (0.78 %) |
201.7 (0.07 %) |
3,604.5 (1.24 %) |
| 2022 | 23,883.7 (8.29 %) |
5,836.5 (2.03 %) |
25.0 (0.01 %) |
10,675.3 (3.70 %) |
3,577.5 (1.24 %) |
164.3 (0.06 %) |
3,605.1 (1.25 %) |
| 2023 | 26,995.4 (9.56 %) |
3,963.0 (1.40 %) |
23.2 (0.01 %) |
12,909.7 (4.57 %) |
6,238.3 (2.21 %) |
244.2 (0.09 %) |
3,617.0 (1.28 %) |
| 2024 | 33,916.6 (11.73 %) |
4,208.2 (1.46 %) |
26.7 (0.01 %) |
15,295.9 (5.29 %) |
10,509.8 (3.63 %) |
237.7 (0.08 %) |
3,638.3 (1.26 %) |
Source: Energy Statistics Handbook 2020, p. 85-86; 2021, 2022, 2023 and 2024, p. 44-47
TOP HOME [◆ Statistics] [Energy]
Domestic power consumption
| Year | Total (GWh) |
Energy sector own use (%) |
Indus- trial (%) |
Transpor- tation (%) |
Agricul- tural (%) |
Services (%) |
Residen- tial (%) |
Line loss rate (%) |
|---|---|---|---|---|---|---|---|---|
| 2000 | 176,503.4 | 9.33 | 49.78 | 0.26 | 1.28 | 19.77 | 19.57 | 5.58 |
| 2005 | 218,457.5 | 8.95 | 50.12 | 0.26 | 1.14 | 20.17 | 19.37 | 4.76 |
| 2010 | 237,407.3 | 8.01 | 52.76 | 0.50 | 1.10 | 19.33 | 18.29 | 4.66 |
| 2011 | 242,086.3 | 7.87 | 53.24 | 0.51 | 1.13 | 18.91 | 18.35 | 4.76 |
| 2012 | 241,111.6 | 7.73 | 53.72 | 0.53 | 1.12 | 18.97 | 17.93 | 4.42 |
| 2013 | 245,123.4 | 7.51 | 54.35 | 0.54 | 1.12 | 18.71 | 17.78 | 4.25 |
| 2014 | 251,100.4 | 7.50 | 54.33 | 0.55 | 1.13 | 18.50 | 17.99 | 4.09 |
| 2015 | 250,019.3 | 7.60 | 53.88 | 0.56 | 1.17 | 18.85 | 17.95 | 3.72 |
| 2016 | 255,420.1 | 7.41 | 53.59 | 0.56 | 1.14 | 18.77 | 18.53 | 3.85 |
| 2017 | 261,394.6 | 7.59 | 53.98 | 0.57 | 1.16 | 18.47 | 18.21 | 3.82 |
| 2018 | 266,558.6 | 7.19 | 55.88 | 0.57 | 1.11 | 17.67 | 17.58 | 3.94 |
| 2019 | 265,722.8 | 7.37 | 55.59 | 0.59 | 1.15 | 17.57 | 17.73 | 3.86 |
| 2020 | 271,235.7 | 7.12 | 55.63 | 0.58 | 1.21 | 17.00 | 18.46 | 3.97 |
| 2021 | 283,178.9 | 6.65 | 57.07 | 0.54 | 1.17 | 16.03 | 18.55 | 3.53 |
| 2022 | 279,028.5 | 6.80 | 56.25 | 0.59 | 1.17 | 16.99 | 18.20 | 3.82 |
| 2023 | 275,794.3 | 6.69 | 55.27 | 0.67 | 1.19 | 17.51 | 18.67 | 3.20 |
| 2024 | 283,845.7 | 6.52 | 55.16 | 0.67 | 1.20 | 17.62 | 18.83 | 2.93 |
The line loss rate data is from the Taiwan Power Company, click
here.
Source: Energy Statistics Handbook 2020, p. 87-88; 2021, p. 14, 73-74; 2022 and 2023, p. 73-74
TOP HOME [◆ Statistics] [Energy]
For comparison, the tables directly below shows data from the NDC's
Taiwan Statistical Data Book 2019—power generation (tables 5-6a, 5-6b), power consumption (table 5-6b).
Power generation
| Year | Total (million kWh) | Hydro (%) | Thermal (%) | Nuclear (%) | Wind (%) | Solar (%) | BioEnergy (%) |
|---|---|---|---|---|---|---|---|
| 1952 | 1,420 | 86.7 | 13.3 | — | — | — | — |
| 1955 | 1,966 | 77.9 | 22.1 | — | — | — | — |
| 1960 | 3,628 | 56.9 | 43.1 | — | — | — | — |
| 1965 | 6,455 | 40.1 | 59.9 | — | — | — | — |
| 1970 | 13,213 | 21.5 | 78.5 | — | — | — | — |
| 1975 | 22,894 | 22.9 | 77.1 | — | — | — | — |
| 1980 | 40,813 | 7.1 | 73.7 | 19.2 | — | — | — |
| 1985 | 52,556 | 13.1 | 34.5 | 52.4 | — | — | — |
| 1990 | 82,350 | 9.9 | 51.8 | 38.3 | — | — | — |
| 1995 | 117,859 | 7.5 | 63.7 | 28.8 | — | — | — |
| 2000 | 156,511 | 5.7 | 70.7 | 23.6 | — | — | — |
| 2005 | 189,663 | 4.2 | 75.6 | 20.2 | 0.042 | — | — |
| 2010 | 207,385 | 3.5 | 76.7 | 19.3 | 0.493 | 0.0030 | — |
| 2011 | 213,042 | 3.2 | 77.0 | 19.0 | 0.719 | 0.0179 | — |
| 2012 | 211,708 | 4.0 | 76.8 | 18.4 | 0.704 | 0.0654 | — |
| 2013 | 213,429 | 4.0 | 76.3 | 18.8 | 0.758 | 0.1411 | — |
| 2014 | 219,224 | 3.4 | 77.1 | 18.6 | 0.678 | 0.2334 | — |
| 2015 | 219,104 | 3.4 | 79.5 | 16.0 | 0.686 | 0.370 | 0.001 |
| 2016 | 225,793 | 4.3 | 81.0 | 13.5 | 0.641 | 0.473 | 0.001 |
| 2017 | 231,076 | 3.8 | 85.4 | 9.3 | 0.733 | 0.701 | 0.001 |
| 2018 | 233,289 | 3.3 | 83.4 | 11.4 | 0.704 | 1.141 | 0.002 |
Power consumption
| Year | Industry (%) | Residential/ commercial (%) |
Year | Industry (%) | Residential/ commercial (%) |
|
|---|---|---|---|---|---|---|
| 1952 | 75.9 | 24.1 | 2005 | 67.1 | 32.9 | |
| 1955 | 77.3 | 22.7 | 2010 | 69.4 | 30.6 | |
| 1960 | 81.2 | 18.8 | 2011 | 69.6 | 30.4 | |
| 1965 | 80.3 | 19.7 | 2012 | 70.1 | 29.9 | |
| 1970 | 77.2 | 22.8 | 2013 | 70.6 | 29.4 | |
| 1975 | 75.9 | 24.1 | 2014 | 70.2 | 29.8 | |
| 1980 | 75.9 | 24.1 | 2015 | 70.4 | 29.6 | |
| 1985 | 72.9 | 27.1 | 2016 | 70.0 | 30.0 | |
| 1990 | 69.7 | 30.3 | 2017 | 70.5 | 29.5 | |
| 1995 | 65.4 | 34.6 | 2018 | 71.0 | 29.0 | |
| 2000 | 66.5 | 33.5 | ||||
TOP HOME [◆ Statistics] [Energy]
===== ===== ===== ===== =====
◆ The ROC postal codes (with numerical index)
++++++++++ TOP HOME [next chapter] [previous chapter] ++++++++++
Introduction
- 3 digits, 5 digits—and now also 6 digits
- Nine large postal zones of the ROC
- ROC postal index (3-digit)—an overview
3 digits, 5 digits—and now also 6 digits
Anybody who has lived in Taiwan for a while or corresponded with persons, organizations or businesses residing in Taiwan will discover sooner or later that addresses sometimes come with a 3-digit postal code and sometimes with a 5-digit postal code. In fact, since Feb. 1, 1991 any address in the Taiwan area is supposed to have a 5-digit postal code.
Lists detailling the locations in the Taiwan area with their respective 3-digit postal code fit on an A4 page and are readily available because they are often printed in small script
on the back side of standard letter envelopes sold in stationary shops. Administrative units in special municipalities, counties and county-level cities in the ROC having
their own 3-digit postal code include the following:
• districts (qu 區);
• cities (shi 市),
• urban townships (zhen 鎮), and
• rural townships (xiang 鄉).
A location's correct 5-digit postal code is a little bit more complicated to determine. The Chunghwa Post publishes and regularly updates a directory (Title in Chinese: 台灣地區 3+2 碼郵遞區號簿) containing the 5-digit postal codes for all addresses in the Taiwan area, but most people don't own a copy of the directory (and nowadays there are specialized online search engines for that purpose available anyway), and likewise few people bother checking the copy available in their post office. According to the directory, the first three digits represent the third-level administrative district number (xingzhengqu bianhao 行政區編號) of the respective location like "100" for Taipei's Zhongzheng District 中正區, and their use is required for sending items with regular mail. The last two digits represent the delivery zone number (toudi quduan xuhao 投遞區段序號) or the delivery special-use number (toudi zhuanyong haoma 投遞專用號碼) for bigger customers, and using them is optional but will speed the delivery of mailed items.
On March 3, 2020 the Chunghwa Post launched a new system called "3+3 ZIP Code System" (san jia san ma youdi quhao 3+3 碼郵遞區號) to improve the efficiency of mail processing. With the new system in effect, the first 3 numbers of the ZIP code remain unchanged, while the last 3 numbers ("Delivery Zone Code") are extended to 3-digit from 2-digit in order to simplify the handling process, increase mail sorting efficiency, and improve delivery accuracy. For Chunghwa Post's online ZIP code directory (3+3) click here.
Please note that the first digit in each ROC postal code indicates to which of the country's nine large postal zones (da youdiqu 大郵遞區) it belongs.
TOP HOME [◆ ROC postal codes] [Introduction]
Nine large postal zones of the ROC
| First digit | City / county |
|---|---|
| 1 | Taipei City |
| 2 | Keelung City, New Taipei City, Yilan County, Lienchiang County (= Matsu) |
| 3 | Taoyuan City, Hsinchu City, Hsinchu County, Miaoli County |
| 4 | Taichung City |
| 5 | Changhua County, Nantou County |
| 6 | Yunlin County, Chiayi City, Chiayi County |
| 7 | Tainan City |
| 8 | Kaohsiung City, Penghu County, Kinmen County |
| 9 | Pingtung County, Hualien County, Taitung County |

After the ROC took control of Taiwan and Penghu following the surrender of the Japanese at the end of WWII, the initial local subdivision of cities and counties by and large copied the system the Japanese colonial rulers had left behind. That structure is also reflected in the ROC postal zones as shown above, although the counties of Kinmen and Lienchiang (= Matsu) which had not been under Japanese control before 1945 had to be added to the postal codes' order of Taiwan and Penghu.
TOP HOME [◆ ROC postal codes] [Introduction]
ROC postal index (3-digit)—an overview
The following list shows the 3-digit postal codes for all districts, cities, urban townships ⒰ and rural townships ⒭ under ROC special municipalities and county-level cities and counties in numerical order. ① = districts; ② = cities, ③ = urban townships, ④ = rural townships.
| City / county | ROC postal code(s) | ① | ② | ③ | ④ |
|---|---|---|---|---|---|
| Taipei City | 100–116 | 12 | — | — | — |
| Keelung City | 200–206 | 7 | — | — | — |
| New Taipei City | 207–208, 220–253 | 29 | — | — | — |
| Lienchiang County | 209–212 | — | 0 | 0 | 4 |
| Yilan County | 260–272 | — | 1 | 3 | 8 |
| Diaoyutai [⚔] | 290 | ||||
| Hsinchu City | 300 | 3 | — | — | — |
| Hsinchu County | 302–315 | — | 1 | 3 | 9 |
| Taoyuan City | 320–338 | 13 | — | — | — |
| Miaoli County | 350–369 | — | 2 | 5 | 11 |
| Taichung City | 400–439 | 29 | — | — | — |
| Changhua County | 500–530 | — | 2 | 6 | 18 |
| Nantou County | 540–558 | — | 1 | 4 | 8 |
| Chiayi City | 600 | 2 | — | — | — |
| Chiayi County | 602–625 | — | 2 | 2 | 14 |
| Yunlin County | 630–655 | — | 1 | 5 | 14 |
| Tainan City | 700–745 | 37 | — | — | — |
| Kaohsiung City | 800–852 | 38 | — | — | — |
| Penghu County | 880–885 | — | 1 | 0 | 5 |
| Kinmen County | 890–896 | — | 0 | 3 | 3 |
| Pingtung County | 900–947 | — | 1 | 3 | 29 |
| Taitung County | 950–966 | — | 1 | 2 | 13 |
| Hualien County | 970–983 | — | 1 | 2 | 10 |
Altogether, the ROC has 365 three-digit postal codes, including 170 districts in special municipalities plus 14 cities, 38 urban townships and 146 rural townships in county-level cities and counties. The number of postal codes is not identical with the sum of administrative districts in the ROC which stands at 368—the three districts in Hsinchu City have the same postal code (300), as have the two districts in Chiayi City (600). Not included in these figures are three additional postal codes—Diaoyutai (290) under Yilan County as well as the South China Sea islands Pratas Islands (817) and Taiping/Spratly Islands (819) under Kaohsiung City.
| Before their respective upgrade in 2010, the postal codes for Taichung, Tainan and Kaohsiung were distinguished as shown in the table on the right. |
Before 12/2010 | ~ City | ~ County |
|---|---|---|---|
| Taichung | 400–408 | 411–439 | |
| Tainan | 700–709 | 710–745 | |
| Kaohsiung | 800–813 | 814–852 |
TOP HOME [◆ ROC postal codes] [Introduction]
Detailed ROC postal index
|
• Taipei City • Keelung City • New Taipei City • Lienchiang County • Yilan County • Hsinchu City |
• Hsinchu County • Taoyuan City • Miaoli County • Taichung City • Changhua County • Nantou County |
• Chiayi City • Chiayi County • Yunlin County • Tainan City • Kaohsiung City • Penghu County |
• Kinmen County • Pingtung County • Taitung County • Hualien County |
| • 100 • 200 • 300 • 400 • 500 • 600 • 700 • 800 • 900 | |||
In the following lists, urban townships are marked with a ⒰ and rural townships with an ⒭. An alphabetical index of all cities, counties, districts, rural townships and urban townships of the ROC including the respective 3-digit ROC postal code can be found here. For additional information about Taiwan's indigenous communities (including their postal codes) click here.
TAIPEI CITY 台北市: 12 districts
| 100 Zhongzheng District 中正區 103 Datong District 大同區 104 Zhongshan District 中山區 105 Songshan District 松山區 106 Da'an District 大安區 108 Wanhua District 萬華區 |
110 Xinyi District 信義區 111 Shilin District 士林區 112 Beitou District 北投區 114 Neihu District 內湖區 115 Nangang District 南港區 116 Wenshan District 文山區 |
TOP HOME [◆ ROC postal codes] [Detailed index]
KEELUNG CITY 基隆市: 7 districts
| 200 Ren'ai District 仁愛區 201 Xinyi District 信義區 202 Zhongzheng District 中正區 * 203 Zhongshan District 中山區 | 204 Anle District 安樂區 205 Nuannuan District 暖暖區 206 Qidu District 七堵區 |
* 202 (Zhongzheng District) includes Heping Island 和平島, Keelung Islet 基隆嶼, and the Three Northern Islets 北方三島.
TOP HOME [◆ ROC postal codes] [Detailed index]
NEW TAIPEI CITY 新北市: 29 districts,
including 1 Mountain Aborigines community (Ⓜ)
| 207 Wanli District 萬里區 208 Jinshan District 金山區 |
235 Zhonghe District 中和區 236 Tucheng District 土城區 237 Sanxia District 三峽區 238 Shulin District 樹林區 239 Yingge District 鶯歌區 241 Sanchong District 三重區 242 Xinzhuang District 新莊區 243 Taishan District 泰山區 244 Linkou District 林口區 247 Luzhou District 蘆洲區 248 Wugu District 五股區 249 Bali District 八里區 251 Danshui District 淡水區 252 Sanzhi District 三芝區 253 Shimen District 石門區 |
| 220 Banqiao District 板橋區 221 Xizhi District 汐止區 222 Shenkeng District 深坑區 223 Shiding District 石碇區 224 Ruifang District 瑞芳區 226 Pingxi District 平溪區 227 Shuangxi District 雙溪區 228 Gongliao District 貢寮區 231 Xindian District 新店區 232 Pinglin District 坪林區 233 Wulai District 烏來區 Ⓜ 234 Yonghe District 永和區 |
TOP HOME [◆ ROC postal codes] [Detailed index]
LIENCHIANG COUNTY 連江縣: 0 cities, 0 urban townships, 4 rural townships
| 209 Nan'gan Township 南竿鄉 ⒭ 210 Beigan Township 北竿鄉 ⒭ |
211 Juguang Township 莒光鄉 ⒭ 212 Dongyin Township 東引鄉 ⒭ |
TOP HOME [◆ ROC postal codes] [Detailed index]
YILAN COUNTY 宜蘭縣: 1 city,
3 urban townships, 8 rural townships;
including 2 Mountain Aborigines communities (Ⓜ)
| 260 Yilan City 宜蘭市 261 Toucheng Township 頭城鎮 ⒰ * 262 Jiaoxi Township 礁溪鄉 ⒭ 263 Zhuangwei Township 壯圍鄉 ⒭ 264 Yuanshan Township 員山鄉 ⒭ 265 Luodong Township 羅東鎮 ⒰ |
266 Sanxing Township 三星鄉 ⒭ 267 Datong Township 大同鄉 ⒭ Ⓜ 268 Wujie Township 五結鄉 ⒭ 269 Dongshan Township 冬山鄉 ⒭ 270 Su'ao Township 蘇澳鎮 ⒰ 272 Nan'ao Township 南澳鄉 ⒭ Ⓜ |
* 261 (Toucheng Township) includes Guishan Island 龜山島.
Note: Although the Diaoyutai Islands (Diaoyutai lieyu 釣魚臺列嶼) are formally listed with the postal code of 290 under Toucheng Township's Daxi Borough 大溪里 of Yilan County, Chunghwa Post does not offer postal services there and doesn't provide delivery of mailed items to the uninhabited, Japan-controlled archipelago. For more information about the Diaoyutai Islands please refer to the page Local administration, chapter Yilan County, "Disputed outpost".
TOP HOME [◆ ROC postal codes] [Detailed index]
HSINCHU CITY 新竹市: 3 districts
| 300 East District 東區 300 North District 北區 |
300 Xiangshan District 香山區 |
TOP HOME [◆ ROC postal codes] [Detailed index]
HSINCHU COUNTY 新竹縣: 1 city,
3 urban townships, 9 rural townships;
including 2 Mountain Aborigines communities (Ⓜ) and 1 Plains Aborigines community
(Ⓟ)
| 302 Zhubei City 竹北市 303 Hukou Township 湖口鄉 ⒭ 304 Xinfeng Township 新豐鄉 ⒭ 305 Xinpu Township 新埔鎮 ⒰ 306 Guanxi Township 關西鎮 ⒰ Ⓟ 307 Qionglin Township 芎林鄉 ⒭ 308 Baoshan Township 寶山鄉 ⒭ |
310 Zhudong Township 竹東鎮 ⒰ 311 Wufeng Township 五峰鄉 ⒭ Ⓜ 312 Hengshan Township 橫山鄉 ⒭ 313 Jianshi Township 尖石鄉 ⒭ Ⓜ 314 Beipu Township 北埔鄉 ⒭ 315 Emei Township 峨眉鄉 ⒭ |
TOP HOME [◆ ROC postal codes] [Detailed index]
TAOYUAN CITY 桃園市: 13 districts,
including 1 Mountain Aborigines community (Ⓜ)
| 320 Zhongli District 中壢區 324 Pingzhen District 平鎮區 325 Longtan District 龍潭區 326 Yangmei District 楊梅區 327 Xinwu District 新屋區 328 Guanyin District 觀音區 330 Taoyuan District 桃園區 |
333 Guishan District 龜山區 334 Bade District 八德區 335 Daxi District 大溪區 336 Fuxing District 復興區 Ⓜ 337 Dayuan District 大園區 338 Luzhu District 蘆竹區 |
TOP HOME [◆ ROC postal codes] [Detailed index]
MIAOLI COUNTY 苗栗縣: 2 cities,
5 urban townships, 11 rural townships;
including 1 Mountain Aborigines community (Ⓜ) and 2 Plains Aborigines communities
(Ⓟ)
| 350 Zhunan Township 竹南鎮 ⒰ 351 Toufen City 頭份市 352 Sanwan Township 三灣鄉 ⒭ 353 Nanzhuang Township 南庄鄉 ⒭ Ⓟ 354 Shitan Township 獅潭鄉 ⒭ Ⓟ 356 Houlong Township 後龍鎮 ⒰ 357 Tongxiao Township 通霄鎮 ⒰ 358 Yuanli Township 苑裡鎮 ⒰ 360 Miaoli City 苗栗市 |
361 Zaoqiao Township 造橋鄉 ⒭ 362 Touwu Township 頭屋鄉 ⒭ 363 Gongguan Township 公館鄉 ⒭ 364 Dahu Township 大湖鄉 ⒭ 365 Tai'an Township 泰安鄉 ⒭ Ⓜ 366 Tongluo Township 銅鑼鄉 ⒭ 367 Sanyi Township 三義鄉 ⒭ 368 Xihu Township 西湖鄉 ⒭ 369 Zhuolan Township 卓蘭鎮⒰ |
TOP HOME [◆ ROC postal codes] [Detailed index]
TAICHUNG CITY 台中市: 29 districts [8 old],
including 1 Mountain Aborigines community (Ⓜ)
| 400 Central District 中區 401 East District 東區 402 South District 南區 403 West District 西區 404 North District 北區 406 Beitun District 北屯區 407 Xitun District 西屯區 408 Nantun District 南屯區 |
422 Shigang District 石岡區 423 Dongshi District 東勢區 424 Heping District 和平區 Ⓜ 426 Xinshe District 新社區 427 Tanzi District 潭子區 428 Daya District 大雅區 429 Shengang District 神岡區 432 Dadu District 大肚區 433 Shalu District 沙鹿區 434 Longjing District 龍井區 435 Wuqi District 梧棲區 436 Qingshui District 清水區 437 Dajia District 大甲區 438 Waipu District 外埔區 439 Da'an District 大安區 |
| 411 Taiping District 太平區 412 Dali District 大里區 413 Wufeng District 霧峰區 414 Wuri District 烏日區 420 Fengyuan District 豐原區 421 Houli District 后里區 |
TOP HOME [◆ ROC postal codes] [Detailed index]
CHANGHUA COUNTY 彰化縣: 2 cities, 6 urban townships, 18 rural townships
| 500 Changhua City 彰化市 502 Fenyuan Township 芬園鄉 ⒭ 503 Huatan Township 花壇鄉 ⒭ 504 Xiushui Township 秀水鄉 ⒭ 505 Lugang Township 鹿港鎮 ⒰ 506 Fuxing Township 福興鄉 ⒭ 507 Xianxi Township 線西鄉 ⒭ 508 Hemei Township 和美鎮 ⒰ 509 Shengang Township 伸港鄉 ⒭ 510 Yuanlin City 員林市 511 Shetou Township 社頭鄉 ⒭ 512 Yongjing Township 永靖鄉 ⒭ 513 Puxin Township 埔心鄉 ⒭ |
514 Xihu Township 溪湖鎮 ⒰ 515 Dacun Township 大村鄉 ⒭ 516 Puyan Township 埔鹽鄉 ⒭ 520 Tianzhong Township 田中鎮 ⒰ 521 Beidou Township 北斗鎮 ⒰ 522 Tianwei Township 田尾鄉 ⒭ 523 Pitou Township 埤頭鄉 ⒭ 524 Xizhou Township 溪州鄉 ⒭ 525 Zhutang Township 竹塘鄉 ⒭ 526 Erlin Township 二林鎮 ⒰ 527 Dacheng Township 大城鄉 ⒭ 528 Fangyuan Township 芳苑鄉 ⒭ 530 Ershui Township 二水鄉 ⒭ |
TOP HOME [◆ ROC postal codes] [Detailed index]
NANTOU COUNTY 南投縣: 1 city,
4 urban townships, 8 rural townships;
including 2 Mountain Aborigines communities (Ⓜ) and 1 Plains Aborigines community
(Ⓟ)
| 540 Nantou City 南投市 541 Zhongliao Township 中寮鄉 ⒭ 542 Caotun Township 草屯鎮 ⒰ 544 Guoxing Township 國姓鄉 ⒭ 545 Puli Township 埔里鎮 ⒰ 546 Ren'ai Township 仁愛鄉 ⒭ Ⓜ 551 Mingjian Township 名間鄉 ⒭ |
552 Jiji Township 集集鎮 ⒰ 553 Shuili Township 水里鄉 ⒭ 555 Yuchi Township 魚池鄉 ⒭ Ⓟ 556 Xinyi Township 信義鄉 ⒭ Ⓜ 557 Zhushan Township 竹山鎮 ⒰ 558 Lugu Township 鹿谷鄉 ⒭ |
TOP HOME [◆ ROC postal codes] [Detailed index]
CHIAYI CITY 嘉義市: 2 districts
| 600 East District 東區 | 600 West District 西區 |
TOP HOME [◆ ROC postal codes] [Detailed index]
CHIAYI COUNTY 嘉義縣: 2 cities,
2 urban townships, 14 rural townships;
including 1 Mountain Aborigines community (Ⓜ)
| 602 Fanlu Township 番路鄉 ⒭ 603 Meishan Township 梅山鄉 ⒭ 604 Zhuqi Township 竹崎鄉 ⒭ 605 Alishan Township 阿里山鄉 ⒭ Ⓜ 606 Zhongpu Township 中埔鄉 ⒭ 607 Dapu Township 大埔鄉 ⒭ 608 Shuishang Township 水上鄉 ⒭ 611 Lucao Township 鹿草鄉 ⒭ 612 Taibao City 太保市 |
613 Puzi City 朴子市 614 Dongshi Township 東石鄉 ⒭ 615 Liujiao Township 六腳鄉 ⒭ 616 Xingang Township 新港鄉 ⒭ 621 Minxiong Township 民雄鄉 ⒭ 622 Dalin Township 大林鎮 ⒰ 623 Xikou Township 溪口鄉 ⒭ 624 Yizhu Township 義竹鄉 ⒭ 625 Budai Township 布袋鎮 ⒰ |
TOP HOME [◆ ROC postal codes] [Detailed index]
YUNLIN COUNTY 雲林縣: 1 city, 5 urban townships, 14 rural townships
| 630 Dounan Township 斗南鎮 ⒰ 631 Dapi Township 大埤鄉 ⒭ 632 Huwei Township 虎尾鎮 ⒰ 633 Tuku Township 土庫鎮 ⒰ 634 Baozhong Township 褒忠鄉 ⒭ 635 Dongshi Township 東勢鄉 ⒭ 636 Taixi Township 台西鄉 ⒭ 637 Lunbei Township 崙背鄉 ⒭ 638 Mailiao Township 麥寮鄉 ⒭ 640 Douliu City 斗六市 |
643 Linnei Township 林內鄉 ⒭ 646 Gukeng Township 古坑鄉 ⒭ 647 Citong Township 莿桐鄉 ⒭ 648 Xiluo Township 西螺鎮 ⒰ 649 Erlun Township 二崙鄉 ⒭ 651 Beigang Township 北港鎮 ⒰ 652 Shuilin Township 水林鄉 ⒭ 653 Kouhu Township 口湖鄉 ⒭ 654 Sihu Township 四湖鄉 ⒭ 655 Yuanchang Township 元長鄉 ⒭ |
TOP HOME [◆ ROC postal codes] [Detailed index]
TAINAN CITY 台南市: 37 districts [6 old]
| 700 West Central District 中西區 701 East District 東區 702 South District 南區 704 North District 北區 708 Anping District 安平區 709 Annan District 安南區 |
722 Jiali District 佳里區 723 Xigang District 西港區 724 Qigu District 七股區 725 Jiangjun District 將軍區 726 Xuejia District 學甲區 727 Beimen District 北門區 730 Xinying District 新營區 731 Houbi District 後壁區 732 Baihe District 白河區 733 Dongshan District 東山區 734 Liujia District 六甲區 735 Xiaying District 下營區 736 Liuying District 柳營區 737 Yanshui District 鹽水區 741 Shanhua District 善化區 742 Danei District 大內區 743 Shanshang District 山上區 744 Xinshi District 新市區 745 Anding District 安定區 |
| 710 Yongkang District 永康區 711 Guiren District 歸仁區 712 Xinhua District 新化區 713 Zuozhen District 左鎮區 714 Yujing District 玉井區 715 Nanxi District 楠西區 716 Nanhua District 南化區 717 Rende District 仁德區 718 Guanmiao District 關廟區 719 Longqi District 龍崎區 720 Guantian District 官田區 721 Madou District 麻豆區 |
TOP HOME [◆ ROC postal codes] [Detailed index]
KAOHSIUNG CITY 高雄市: 38 districts [11 old],
including 3 Mountain Aborigines communities (Ⓜ)
| 800 Xinxing District 新興區 801 Qianjin District 前金區 802 Lingya District 苓雅區 803 Yancheng District 鹽埕區 804 Gushan District 鼓山區 805 Qijin District 旗津區 806 Qianzhen District 前鎮區 807 Sanmin District 三民區 811 Nanzi District 楠梓區 812 Xiaogang District 小港區 813 Zuoying District 左營區 |
826 Ziguan District 梓官區 827 Mituo District 彌陀區 828 Yong'an District 永安區 829 Hunei District 湖內區 830 Fengshan District 鳳山區 831 Daliao District 大寮區 832 Linyuan District 林園區 833 Niaosong District 鳥松區 840 Dashu District 大樹區 842 Qishan District 旗山區 843 Meinong District 美濃區 844 Liugui District 六龜區 845 Neimen District 內門區 846 Shanlin District 杉林區 847 Jiaxian District 甲仙區 848 Taoyuan District 桃源區 Ⓜ 849 Namaxia District 那瑪夏區 Ⓜ 851 Maolin District 茂林區 Ⓜ 852 Qieding District 茄萣區 |
| 814 Renwu District 仁武區 815 Dashe District 大社區 820 Gangshan District 岡山區 821 Luzhu District 路竹區 822 Alian District 阿蓮區 823 Tianliao District 田寮區 824 Yanchao District 燕巢區 825 Qiaotou District 橋頭區 |
Note: Two entities referred to as South China Sea Islands (nanhai zhudao 南海諸島)—Pratas Islands 東沙 with the postal code 817, and Taiping/Spratly Islands 南沙 with the postal code 819—have no regular civilian population and administratively belong to Zhongxing Borough 中興里 in Kaohsiung's Qijin District (805).
TOP HOME [◆ ROC postal codes] [Detailed index]
PENGHU COUNTY 澎湖縣: 1 city, 0 urban townships, 5 rural townships
| 880 Magong City 馬公市 881 Xiyu Township 西嶼鄉 ⒭ 882 Wang'an Township 望安鄉 ⒭ |
883 Qimei Township 七美鄉 ⒭ 884 Baisha Township 白沙鄉 ⒭ 885 Huxi Township 湖西鄉 ⒭ |
TOP HOME [◆ ROC postal codes] [Detailed index]
KINMEN COUNTY 金門縣: 0 cities, 3 urban townships, 3 rural townships
| 890 Jinsha Township 金沙鎮 ⒰ 891 Jinhu Township 金湖鎮 ⒰ 892 Jinning Township 金寧鄉 ⒭ |
893 Jincheng Township 金城鎮 ⒰ 894 Lieyu Township 烈嶼鄉 ⒭ 896 Wuqiu Township 烏坵鄉 ⒭ |
TOP HOME [◆ ROC postal codes] [Detailed index]
PINGTUNG COUNTY 屏東縣: 1 city,
3 urban townships, 29 rural townships;
including 8 Mountain Aborigines communities (Ⓜ) and 1 Plains Aborigines community
(Ⓟ)
| 900 Pingtung City 屏東市 901 Sandimen Township 三地門鄉 ⒭ Ⓜ 902 Wutai Township 霧台鄉 ⒭ Ⓜ 903 Majia Township 瑪家鄉 ⒭ Ⓜ 904 Jiuru Township 九如鄉 ⒭ 905 Ligang Township 里港鄉 ⒭ 906 Gaoshu Township 高樹鄉 ⒭ 907 Yanpu Township 鹽埔鄉 ⒭ 908 Changzhi Township 長治鄉 ⒭ 909 Linluo Township 麟洛鄉 ⒭ 911 Zhutian Township 竹田鄉 ⒭ 912 Neipu Township 內埔鄉 ⒭ 913 Wandan Township 萬丹鄉 ⒭ 920 Chaozhou Township 潮州鎮 ⒰ 921 Taiwu Township 泰武鄉 ⒭ Ⓜ 922 Laiyi Township 來義鄉 ⒭ Ⓜ 923 Wanluan Township 萬巒鄉 ⒭ |
924 Kanding Township 崁頂鄉 ⒭ 925 Xinpi Township 新埤鄉 ⒭ 926 Nanzhou Township 南州鄉 ⒭ 927 Linbian Township 林邊鄉 ⒭ 928 Donggang Township 東港鎮 ⒰ 929 Liuqiu Township 琉球鄉 ⒭ 931 Jiadong Township 佳冬鄉 ⒭ 932 Xinyuan Township 新園鄉 ⒭ 940 Fangliao Township 枋寮鄉 ⒭ 941 Fangshan Township 枋山鄉 ⒭ 942 Chunri Township 春日鄉 ⒭ Ⓜ 943 Shizi Township 獅子鄉 ⒭ Ⓜ 944 Checheng Township 車城鄉 ⒭ 945 Mudan Township 牡丹鄉 ⒭ Ⓜ 946 Hengchun Township 恆春鎮 ⒰ 947 Manzhou Township 滿州鄉 ⒭ Ⓟ |
TOP HOME [◆ ROC postal codes] [Detailed index]
TAITUNG COUNTY 台東縣: 1 city,
2 urban townships, 13 rural townships;
including 5 Mountain Aborigines communities (Ⓜ) and 10 Plains Aborigines communities
(Ⓟ)
| 950 Taitung City 台東市 Ⓟ 951 Ludao Township 綠島鄉 ⒭ 952 Lanyu Township 蘭嶼鄉 ⒭ Ⓜ 953 Yanping Township 延平鄉 ⒭ Ⓜ 954 Beinan Township 卑南鄉 ⒭ Ⓟ 955 Luye Township 鹿野鄉 ⒭ Ⓟ 956 Guanshan Township 關山鎮 ⒰ Ⓟ 957 Haiduan Township 海端鄉 ⒭ Ⓜ |
958 Chishang Township 池上鄉 ⒭ Ⓟ 959 Donghe Township 東河鄉 ⒭ Ⓟ 961 Chenggong Township 成功鎮 ⒰ Ⓟ 962 Changbin Township 長濱鄉 ⒭ Ⓟ 963 Taimali Township 太麻里鄉 ⒭ Ⓟ 964 Jinfeng Township 金峰鄉 ⒭ Ⓜ 965 Dawu Township 大武鄉 ⒭ Ⓟ 966 Daren Township 達仁鄉 ⒭ Ⓜ |
TOP HOME [◆ ROC postal codes] [Detailed index]
HUALIEN COUNTY 花蓮縣: 1 city,
2 urban townships, 10 rural townships;
including 3 Mountain Aborigines communities (Ⓜ) and 10 Plains Aborigines communities
(Ⓟ)
| 970 Hualien City 花蓮市 Ⓟ 971 Xincheng Township 新城鄉 ⒭ Ⓟ 972 Xiulin Township 秀林鄉 ⒭ Ⓜ 973 Ji'an Township 吉安鄉 ⒭ Ⓟ 974 Shoufeng Township 壽豐鄉 ⒭ Ⓟ 975 Fenglin Township 鳳林鎮 ⒰ Ⓟ 976 Guangfu Township 光復鄉 ⒭ Ⓟ |
977 Fengbin Township 豐濱鄉 ⒭ Ⓟ 978 Ruisui Township 瑞穗鄉 ⒭ Ⓟ 979 Wanrong Township 萬榮鄉 ⒭ Ⓜ 981 Yuli Township 玉里鎮 ⒰ Ⓟ 982 Zhuoxi Township 卓溪鄉 ⒭ Ⓜ 983 Fuli Township 富里鄉 ⒭ Ⓟ |
 Please note that the order of the 3-digit ROC postal codes features one peculiarity—in the succession of postal
codes between 200 and 253, Keelung City comes first with the postal codes 200–206,
continued with the districts of Wanli 萬里 and Jinshan 金山 in New Taipei
City which have the postal codes 207 and 208, respectively, followed by Lienchiang
County with the postal codes 209–212 and then the rest of New Taipei City with the postal codes 220–253. This
seemingly odd sequence was caused by the historic development: When Taiwan was ruled
by the Japanese, Wanli and Jinshan were in 1920 both made part of Kirun District under Taihoku Prefecture (Taibei
zhou Jilong jun 台北州基隆郡 Taihoku shū Kīrun gun), i. e. Keelung. After WWII they were initially placed
under Keelung District of Taipei County (Taibei xian Jilong qu 臺北縣基隆區), but by 1950 they had become part of
Taipei County and separated from Keelung City.
Please note that the order of the 3-digit ROC postal codes features one peculiarity—in the succession of postal
codes between 200 and 253, Keelung City comes first with the postal codes 200–206,
continued with the districts of Wanli 萬里 and Jinshan 金山 in New Taipei
City which have the postal codes 207 and 208, respectively, followed by Lienchiang
County with the postal codes 209–212 and then the rest of New Taipei City with the postal codes 220–253. This
seemingly odd sequence was caused by the historic development: When Taiwan was ruled
by the Japanese, Wanli and Jinshan were in 1920 both made part of Kirun District under Taihoku Prefecture (Taibei
zhou Jilong jun 台北州基隆郡 Taihoku shū Kīrun gun), i. e. Keelung. After WWII they were initially placed
under Keelung District of Taipei County (Taibei xian Jilong qu 臺北縣基隆區), but by 1950 they had become part of
Taipei County and separated from Keelung City.
[The respective areas in km²—Keelung City: 132.7589, Wanli District: 63.3766, Jinshan District: 49.2132]
TOP HOME [◆ ROC postal codes] [Detailed index]
===== ===== ===== ===== =====
◆ The ROC calendar
++++++++++ TOP HOME [next chapter] [previous chapter] ++++++++++
The ROC has traditionally been using a method for counting the years that was retained from the system which was common before 1912. In Imperial China, the years were counted according to the reign of the ruling emperor (nianhao 年號). When an emperor died, the following year was counted as the first year of the succeeding emperor. Accordingly, after the establishment of the ROC on Jan. 1, 1912, that year was counted as Year One of the Republic (minguo yi nian 民國 1 年), 1913 as Year Two of the Republic (minguo er nian 民國 2 年) and so on. Today's ROC continues using this ancient system, e. g. in official forms. Many elderly Taiwanese are still not familiar with the year numbers of the Gregorian calendar, although the Western system has become more popular among younger Taiwanese since the hype surrounding the year 2000 ("Y2K").
| A.D. | ROC | A.D. | ROC | A.D. | ROC | A.D. | ROC |
|---|---|---|---|---|---|---|---|
| 1912 | 民國 1 年 | 1942 | 民國 31 年 | 1972 | 民國 61 年 | 2002 | 民國 91 年 |
| 1913 | 民國 2 年 | 1943 | 民國 32 年 | 1973 | 民國 62 年 | 2003 | 民國 92 年 |
| 1914 | 民國 3 年 | 1944 | 民國 33 年 | 1974 | 民國 63 年 | 2004 | 民國 93 年 |
| 1915 | 民國 4 年 | 1945 | 民國 34 年 | 1975 | 民國 64 年 | 2005 | 民國 94 年 |
| 1916 | 民國 5 年 | 1946 | 民國 35 年 | 1976 | 民國 65 年 | 2006 | 民國 95 年 |
| 1917 | 民國 6 年 | 1947 | 民國 36 年 | 1977 | 民國 66 年 | 2007 | 民國 96 年 |
| 1918 | 民國 7 年 | 1948 | 民國 37 年 | 1978 | 民國 67 年 | 2008 | 民國 97 年 |
| 1919 | 民國 8 年 | 1949 | 民國 38 年 | 1979 | 民國 68 年 | 2009 | 民國 98 年 |
| 1920 | 民國 9 年 | 1950 | 民國 39 年 | 1980 | 民國 69 年 | 2010 | 民國 99 年 |
| 1921 | 民國 10 年 | 1951 | 民國 40 年 | 1981 | 民國 70 年 | 2011 | 民國 100 年 |
| 1922 | 民國 11 年 | 1952 | 民國 41 年 | 1982 | 民國 71 年 | 2012 | 民國 101 年 |
| 1923 | 民國 12 年 | 1953 | 民國 42 年 | 1983 | 民國 72 年 | 2013 | 民國 102 年 |
| 1924 | 民國 13 年 | 1954 | 民國 43 年 | 1984 | 民國 73 年 | 2014 | 民國 103 年 |
| 1925 | 民國 14 年 | 1955 | 民國 44 年 | 1985 | 民國 74 年 | 2015 | 民國 104 年 |
| 1926 | 民國 15 年 | 1946 | 民國 45 年 | 1986 | 民國 75 年 | 2016 | 民國 105 年 |
| 1927 | 民國 16 年 | 1957 | 民國 46 年 | 1987 | 民國 76 年 | 2017 | 民國 106 年 |
| 1928 | 民國 17 年 | 1958 | 民國 47 年 | 1988 | 民國 77 年 | 2018 | 民國 107 年 |
| 1929 | 民國 18 年 | 1959 | 民國 48 年 | 1989 | 民國 78 年 | 2019 | 民國 108 年 |
| 1930 | 民國 19 年 | 1960 | 民國 49 年 | 1990 | 民國 79 年 | 2020 | 民國 109 年 |
| 1931 | 民國 20 年 | 1961 | 民國 50 年 | 1991 | 民國 80 年 | 2021 | 民國 110 年 |
| 1932 | 民國 21 年 | 1962 | 民國 51 年 | 1992 | 民國 81 年 | 2022 | 民國 111 年 |
| 1933 | 民國 22 年 | 1963 | 民國 52 年 | 1993 | 民國 82 年 | 2023 | 民國 112 年 |
| 1934 | 民國 23 年 | 1944 | 民國 53 年 | 1994 | 民國 83 年 | 2024 | 民國 113 年 |
| 1935 | 民國 24 年 | 1965 | 民國 54 年 | 1995 | 民國 84 年 | 2025 | 民國 114 年 |
| 1936 | 民國 25 年 | 1966 | 民國 55 年 | 1996 | 民國 85 年 | 2026 | 民國 115 年 |
| 1937 | 民國 26 年 | 1967 | 民國 56 年 | 1997 | 民國 86 年 | 2027 | 民國 116 年 |
| 1938 | 民國 27 年 | 1968 | 民國 57 年 | 1998 | 民國 87 年 | ||
| 1939 | 民國 28 年 | 1969 | 民國 58 年 | 1999 | 民國 88 年 | ||
| 1940 | 民國 29 年 | 1970 | 民國 59 年 | 2000 | 民國 89 年 | ||
| 1941 | 民國 30 年 | 1971 | 民國 60 年 | 2001 | 民國 90 年 | ||
Before the ROC
In today's Taiwan, biographies in official records have yet another method to refer to the years prior to the Hsinhai Revolution—the "year before the Republic" (minguoqian 民國前). Since that method applies to years in the last decades of the Qing dynasty (1644-1911), those years would have two denominations, i. e. its respective year before the republic and its reign year of the Qing emperor. The last five Qing emperors were Daoguang 道光, Xianfeng 咸豐, Tongzhi 同治, Guangxu 光緒, and Xuantong 宣統.
| Emperor | Born | Ascension | Died | Reign Year 1 | Lunar New Year |
|---|---|---|---|---|---|
| Daoguang | 1782, Sept. 16 | 1820, Oct. 3 | 1850, Feb. 25 | 1821 | 1821—Feb. 3 |
| Xianfeng | 1831, July 17 | 1850, March 9 | 1861, Aug. 22 | 1851 | 1851—Feb. 1 |
| Tongzhi | 1856, April 27 | 1861, Nov. 11 | 1875, Jan. 12 | 1862 | 1862—Jan. 30 |
| Guangxu | 1871, Aug. 14 | 1875, Feb. 25 | 1908, Nov. 14 | 1875 | 1875—Feb. 6 |
| Xuantong | 1906, Feb. 7 | 1908, Dec. 2 | 1967, Oct. 17 | 1909 | 1909—Jan. 22 |
Please note that among those five emperors, only in the case of Guangxu the first year of the new ruler's reign (as counted in the solar calendar) was the same as the year of his actual ascension, because when his predecessor died in 1875, the date of Tongzhi's death (Jan. 12) was shortly before Lunar New Year (Feb. 6) that year.
Therefore, according to the counting method of year before the republic, 1911 was not only emperor Xuantong's year 3, but also the year 1 before the Republic (minguoqian yinian 民國前一年), 1900 the year 12 before the Republic and so on, as years prior to 1912 can be counted backwards in that manner. The table below shows the data for the last five decades of the Qing dynasty.
| Before ROC | Qing Dynasty | A. D. | Before ROC | Qing Dynasty | A. D. |
|---|---|---|---|---|---|
| 民國前 1 年 | 清宣統 3 年 | 1911 | 民國前 26 年 | 清光緒 12 年 | 1886 |
| 民國前 2 年 | 清宣統 2 年 | 1910 | 民國前 27 年 | 清光緒 11 年 | 1885 |
| 民國前 3 年 | 清宣統元年 | 1909 | 民國前 28 年 | 清光緒 10 年 | 1884 |
| 民國前 4 年 | 清光緒 34 年 | 1908 | 民國前 29 年 | 清光緒 9 年 | 1883 |
| 民國前 5 年 | 清光緒 33 年 | 1907 | 民國前 30 年 | 清光緒 8 年 | 1882 |
| 民國前 6 年 | 清光緒 32 年 | 1906 | 民國前 31 年 | 清光緒 7 年 | 1881 |
| 民國前 7 年 | 清光緒 31 年 | 1905 | 民國前 32 年 | 清光緒 6 年 | 1880 |
| 民國前 8 年 | 清光緒 30 年 | 1904 | 民國前 33 年 | 清光緒 5 年 | 1879 |
| 民國前 9 年 | 清光緒 29 年 | 1903 | 民國前 34 年 | 清光緒 4 年 | 1878 |
| 民國前 10 年 | 清光緒 28 年 | 1902 | 民國前 35 年 | 清光緒 3 年 | 1877 |
| 民國前 11 年 | 清光緒 27 年 | 1901 | 民國前 36 年 | 清光緒 2 年 | 1876 |
| 民國前 12 年 | 清光緒 26 年 | 1900 | 民國前 37 年 | 清光緒元年 | 1875 |
| 民國前 13 年 | 清光緒 25 年 | 1899 | 民國前 38 年 | 清同治 13 年 | 1874 |
| 民國前 14 年 | 清光緒 24 年 | 1898 | 民國前 39 年 | 清同治 12 年 | 1873 |
| 民國前 15 年 | 清光緒 23 年 | 1897 | 民國前 40 年 | 清同治 11 年 | 1872 |
| 民國前 16 年 | 清光緒 22 年 | 1896 | 民國前 41 年 | 清同治 10 年 | 1871 |
| 民國前 17 年 | 清光緒 21 年 | 1895 | 民國前 42 年 | 清同治 9 年 | 1870 |
| 民國前 18 年 | 清光緒 20 年 | 1894 | 民國前 43 年 | 清同治 8 年 | 1869 |
| 民國前 19 年 | 清光緒 19 年 | 1893 | 民國前 44 年 | 清同治 7 年 | 1868 |
| 民國前 20 年 | 清光緒 18 年 | 1892 | 民國前 45 年 | 清同治 6 年 | 1867 |
| 民國前 21 年 | 清光緒 17 年 | 1891 | 民國前 46 年 | 清同治 5 年 | 1866 |
| 民國前 22 年 | 清光緒 16 年 | 1890 | 民國前 47 年 | 清同治 4 年 | 1865 |
| 民國前 23 年 | 清光緒 15 年 | 1889 | 民國前 48 年 | 清同治 3 年 | 1864 |
| 民國前 24 年 | 清光緒 14 年 | 1888 | 民國前 49 年 | 清同治 2 年 | 1863 |
| 民國前 25 年 | 清光緒 13 年 | 1887 | 民國前 50 年 | 清同治元年 | 1862 |
Pronunciation examples in above table:
1911—minguo qian yinian 民國前 1 年 / Qing Xuantong sannian 清宣統 3 年;
1909—minguo qian san nian 民國前 3 年 / Qing Xuantong yuannian 清宣統元年;
1875—minguo qian sanshiqi nian 民國前 37 年 / Qing Guangxu yuannian 清光緒元年;
1862—minguo qian wushi nian 民國前 50 年 / Qing Tongzhi yuannian 清同治元年.
Figures 1-50 in Chinese
| 1 | yi 一 | 11 | shiyi 十一 | 21 | ershiyi 二十一 | 31 | sanshiyi 三十一 | 41 | sishiyi 四十一 | 2 | er 二 | 12 | shier 十二 | 22 | ershier 二十二 | 32 | sanshier 三十二 | 42 | sishier 四十二 | 3 | san 三 | 13 | shisan 十三 | 23 | ershisan 二十三 | 33 | sanshisan 三十三 | 43 | sishisan 四十三 | 4 | si 四 | 14 | shisi 十四 | 24 | ershisi 二十四 | 34 | sanshisi 三十四 | 44 | sishisi 四十四 | 5 | wu 五 | 15 | shiwu 十五 | 25 | ershiwu 二十五 | 35 | sanshiwu 三十五 | 45 | sishiwu 四十五 | 6 | liu 六 | 16 | shiliu 十六 | 26 | ershiliu 二十六 | 36 | sanshiliu 三十六 | 46 | sishiliu 四十六 | 7 | qi 七 | 17 | shiqi 十七 | 27 | ershiqi 二十七 | 37 | sanshiqi 三十七 | 47 | sishiqi 四十七 | 8 | ba 八 | 18 | shiba 十八 | 28 | ershiba 二十八 | 38 | sanshiba 三十八 | 48 | sishiba 四十八 | 9 | jiu 九 | 19 | shijiu 十九 | 29 | ershijiu 二十九 | 39 | sanshijiu 三十九 | 49 | sishijiu 四十九 | 10 | shi 十 | 20 | ershi 二十 | 30 | sanshi 三十 | 40 | sishi 四十 | 50 | wushi 五十 |
TOP HOME [◆ ROC calendar] [Before ROC]
The Lunar Calendar
- Dates of major festivals in the Lunar Calendar
- The Ganzhi cycle and its terminology
- Yin and Yang, the Book of Changes, trigrams and hexagrams
Although China adopted the Gregorian solar calendar in the 20th century, the traditional Chinese lunar calendar (nongli 農曆) is still widely used. Major holidays are observed according to the lunar calendar. As the months and years of the solar and the lunar calendar have different lengths, directories named "Ten Thousand Year Calendar" (wannianli 萬年曆)—sold cheap by most used book stores—can be consulted to identify a lunar date in the solar calendar and vice versa.
The most important festivals in the Lunar Calendar are as follows. For further explanations click here.
- Lunar New Year (guonian 過年) aka Spring Festival (chunjie 春節) falls on the first day of the first lunar month (1-1). Between 1800 and 2100 A.D., Lunar New Year never came earlier than January 21 or later than February 20. Please note that "LNY" is sometimes used as abbreviation for Lunar New Year. In contrast, the transition from old year to new year in the solar calendar, i. e. Dec. 31 to Jan. 1, is called kuanian 跨年 in Chinese.
- The Lantern Festival (yuanxiaojie 元宵節) on the fifteenth day of the first lunar month (1-15) never came earlier than February 4 and later than March 6.
- The Dragon Boat Festival (duanwujie 端午節) on the fifth day of the fifth lunar month (5-5) never came earlier than May 27 and later than June 26.
- The Ghost Festival (zhongyuanjie 中元節) on the fifteenth day of the seventh lunar month (7-15) never came earlier than August 8 and later than September 7.
- The Mid-Autumn Festival/Moon Festival (zhongqiujie 中秋節) on the fifteenth day of the eighth lunar month (8-15) never came earlier than September 7 and later than October 8.
Lunar New Year, the Dragon Boat Festival and the Mid-Autumn Festival are public holidays in the ROC. Many English-language sources refer to Lunar New Year as "Chinese New Year", which is inappropriate as that holiday is observed not only in China and by ethnic Chinese communities but also in other countries and by other ethnic groups.
TOP HOME [◆ ROC calendar] [Lunar calendar]
Dates of major festivals in the Lunar Calendar
- Lunar New Year 1800-1859
- Lunar New Year 1860-1919
- Lunar New Year 1920-1979
- Lunar New Year 1980-2039
- Lunar New Year 2040-2100
- Lantern Festival, Dragon Boat Festival, Ghost Festival, Mid-Autumn Festival 1900-2081
Lunar New Year 1800-1859
| Year | Date | Year | Date | Year | Date | ||
|---|---|---|---|---|---|---|---|
| 1800 | Jan. 25 | 1820 | Feb. 14 | 1840 | Feb. 3 | ||
| 1801 | Feb. 13 | 1821 | Feb. 3 | 1841 | Jan. 23 | ||
| 1802 | Feb. 3 | 1822 | Jan. 23 | 1842 | Feb. 10 | ||
| 1803 | Jan. 23 | 1823 | Feb. 11 | 1843 | Jan. 30 | ||
| 1804 | Feb. 11 | 1824 | Jan. 31 | 1844 | Feb. 18 | ||
| 1805 | Jan. 31 | 1825 | Feb. 18 | 1845 | Feb. 7 | ||
| 1806 | Feb. 18 | 1826 | Feb. 7 | 1846 | Jan. 27 | ||
| 1807 | Feb. 7 | 1827 | Jan. 27 | 1847 | Feb. 15 | ||
| 1808 | Jan. 28 | 1828 | Feb. 15 | 1848 | Feb. 5 | ||
| 1809 | Feb. 14 | 1829 | Feb. 4 | 1849 | Jan. 24 | ||
| 1810 | Feb. 4 | 1830 | Jan. 25 | 1850 | Feb. 12 | ||
| 1811 | Jan. 25 | 1831 | Feb. 13 | 1851 | Feb. 1 | ||
| 1812 | Feb. 13 | 1832 | Feb. 2 | 1852 | Feb. 20 | ||
| 1813 | Feb. 1 | 1833 | Feb. 20 | 1853 | Feb. 8 | ||
| 1814 | Jan. 21 | 1834 | Feb. 9 | 1854 | Jan. 29 | ||
| 1815 | Feb. 9 | 1835 | Jan. 29 | 1855 | Feb. 17 | ||
| 1816 | Jan. 29 | 1836 | Feb. 17 | 1856 | Feb. 6 | ||
| 1817 | Feb. 16 | 1837 | Feb. 5 | 1857 | Jan. 26 | ||
| 1818 | Feb. 5 | 1838 | Jan. 26 | 1858 | Feb. 14 | ||
| 1819 | Jan. 26 | 1839 | Feb. 14 | 1859 | Feb. 3 |
TOP HOME [◆ ROC calendar] [Lunar calendar]
Lunar New Year 1860-1919
| Year | Date | Year | Date | Year | Date | ||
|---|---|---|---|---|---|---|---|
| 1860 | Jan. 23 | 1880 | Feb. 10 | 1900 | Jan. 31 | ||
| 1861 | Feb. 10 | 1881 | Jan. 30 | 1901 | Feb. 19 | ||
| 1862 | Jan. 30 | 1882 | Feb. 18 | 1902 | Feb. 8 | ||
| 1863 | Feb. 18 | 1883 | Feb. 8 | 1903 | Jan. 29 | ||
| 1864 | Feb. 8 | 1884 | Jan. 28 | 1904 | Feb. 16 | ||
| 1865 | Jan. 27 | 1885 | Feb. 15 | 1905 | Feb. 4 | ||
| 1866 | Feb. 15 | 1886 | Feb. 4 | 1906 | Jan. 25 | ||
| 1867 | Feb. 5 | 1887 | Jan. 24 | 1907 | Feb. 13 | ||
| 1868 | Jan. 25 | 1888 | Feb. 12 | 1908 | Feb. 2 | ||
| 1869 | Feb. 11 | 1889 | Jan. 31 | 1909 | Jan. 22 | ||
| 1870 | Jan. 31 | 1890 | Jan. 21 | 1910 | Feb. 10 | ||
| 1871 | Feb. 19 | 1891 | Feb. 9 | 1911 | Jan. 30 | ||
| 1872 | Feb. 9 | 1892 | Jan. 30 | 1912 | Feb. 18 | ||
| 1873 | Jan. 29 | 1893 | Feb. 17 | 1913 | Feb. 6 | ||
| 1874 | Feb. 17 | 1894 | Feb. 66 | 1914 | Jan. 26 | ||
| 1875 | Feb. 6 | 1895 | Jan. 26 | 1915 | Feb. 14 | ||
| 1876 | Jan. 26 | 1896 | Feb. 13 | 1916 | Feb. 3 | ||
| 1877 | Feb. 13 | 1897 | Feb. 2 | 1917 | Jan. 23 | ||
| 1878 | Feb. 2 | 1898 | Jan. 22 | 1918 | Feb. 11 | ||
| 1879 | Jan. 22 | 1899 | Feb. 10 | 1919 | Feb. 1 |
TOP HOME [◆ ROC calendar] [Lunar calendar]
Lunar New Year 1920-1979
| Year | Date | Year | Date | Year | Date | ||
|---|---|---|---|---|---|---|---|
| 1920 | Feb. 20 | 1940 | Feb. 8 | 1960 | Jan. 28 | ||
| 1921 | Feb. 8 | 1941 | Jan. 27 | 1961 | Feb. 15 | ||
| 1922 | Jan. 28 | 1942 | Feb. 15 | 1962 | Feb. 5 | ||
| 1923 | Feb. 16 | 1943 | Feb. 5 | 1963 | Jan. 25 | ||
| 1924 | Feb. 5 | 1944 | Jan. 25 | 1964 | Feb. 13 | ||
| 1925 | Jan. 24 | 1945 | Feb. 13 | 1965 | Feb. 2 | ||
| 1926 | Feb. 13 | 1946 | Feb. 2 | 1966 | Jan. 21 | ||
| 1927 | Feb. 2 | 1947 | Jan. 22 | 1967 | Feb. 9 | ||
| 1928 | Jan. 23 | 1948 | Feb. 10 | 1968 | Jan. 30 | ||
| 1929 | Feb. 10 | 1949 | Jan. 29 | 1969 | Feb. 17 | ||
| 1930 | Jan. 30 | 1950 | Feb. 17 | 1970 | Feb. 6 | ||
| 1931 | Feb. 17 | 1951 | Feb. 6 | 1971 | Jan. 27 | ||
| 1932 | Feb. 6 | 1952 | Jan. 27 | 1972 | Feb. 15 | ||
| 1933 | Jan. 26 | 1953 | Feb. 14 | 1973 | Feb. 3 | ||
| 1934 | Feb. 14 | 1954 | Feb. 3 | 1974 | Jan. 23 | ||
| 1935 | Feb. 4 | 1955 | Jan. 24 | 1975 | Feb. 11 | ||
| 1936 | Jan. 24 | 1956 | Feb. 12 | 1976 | Jan. 31 | ||
| 1937 | Feb. 11 | 1957 | Jan. 31 | 1977 | Feb. 18 | ||
| 1938 | Jan. 31 | 1958 | Feb. 18 | 1978 | Feb. 7 | ||
| 1939 | Feb. 19 | 1959 | Feb. 8 | 1979 | Jan. 28 |
TOP HOME [◆ ROC calendar] [Lunar calendar]
Lunar New Year 1980-2039
| Year | Date | Year | Date | Year | Date | ||
|---|---|---|---|---|---|---|---|
| 1980 | Feb. 16 | 2000 | Feb. 5 | 2020 | Jan. 25 | ||
| 1981 | Feb. 5 | 2001 | Jan. 24 | 2021 | Feb. 12 | ||
| 1982 | Jan. 25 | 2002 | Feb. 12 | 2022 | Feb. 1 | ||
| 1983 | Feb. 13 | 2003 | Feb. 1 | 2023 | Jan. 22 | ||
| 1984 | Feb. 2 | 2004 | Jan. 22 | 2024 | Feb. 10 | ||
| 1985 | Feb. 20 | 2005 | Feb. 9 | 2025 | Jan. 29 | ||
| 1986 | Feb. 9 | 2006 | Jan. 29 | 2026 | Feb. 17 | ||
| 1987 | Jan. 29 | 2007 | Feb. 18 | 2027 | Feb. 6 | ||
| 1988 | Feb. 17 | 2008 | Feb. 7 | 2028 | Jan. 26 | ||
| 1989 | Feb. 6 | 2009 | Jan. 26 | 2029 | Feb. 13 | ||
| 1990 | Jan. 27 | 2010 | Feb. 14 | 2030 | Feb. 3 | ||
| 1991 | Feb. 15 | 2011 | Feb. 3 | 2031 | Jan. 23 | ||
| 1992 | Feb. 4 | 2012 | Jan. 23 | 2032 | Feb. 11 | ||
| 1993 | Jan. 23 | 2013 | Feb. 10 | 2033 | Jan. 31 | ||
| 1994 | Feb. 10 | 2014 | Jan. 31 | 2034 | Feb. 19 | ||
| 1995 | Jan. 31 | 2015 | Feb. 19 | 2035 | Feb. 8 | ||
| 1996 | Feb. 19 | 2016 | Feb. 8 | 2036 | Jan. 28 | ||
| 1997 | Feb. 7 | 2017 | Jan. 28 | 2037 | Feb. 15 | ||
| 1998 | Jan. 28 | 2018 | Feb. 16 | 2038 | Feb. 4 | ||
| 1999 | Feb. 16 | 2019 | Feb. 5 | 2039 | Jan. 24 |
TOP HOME [◆ ROC calendar] [Lunar calendar]
Lunar New Year 2040-2100
| Year | Date | Year | Date | Year | Date | ||
|---|---|---|---|---|---|---|---|
| 2040 | Feb. 12 | 2060 | Feb. 2 | 2080 | Jan. 22 | ||
| 2041 | Feb. 1 | 2061 | Jan. 21 | 2081 | Feb. 9 | ||
| 2042 | Jan. 22 | 2062 | Feb. 9 | 2082 | Jan. 29 | ||
| 2043 | Feb. 10 | 2063 | Jan. 29 | 2083 | Feb. 17 | ||
| 2044 | Jan. 30 | 2064 | Feb. 17 | 2084 | Feb. 6 | ||
| 2045 | Feb. 17 | 2065 | Feb. 5 | 2085 | Jan. 26 | ||
| 2046 | Feb. 6 | 2066 | Jan. 26 | 2086 | Feb. 14 | ||
| 2047 | Jan. 26 | 2067 | Feb. 14 | 2087 | Feb. 3 | ||
| 2048 | Feb. 14 | 2068 | Feb. 3 | 2088 | Jan. 24 | ||
| 2049 | Feb. 2 | 2069 | Jan. 23 | 2089 | Feb. 10 | ||
| 2050 | Jan. 23 | 2070 | Feb. 11 | 2090 | Jan. 30 | ||
| 2051 | Feb. 11 | 2071 | Jan. 31 | 2091 | Feb. 18 | ||
| 2052 | Feb. 1 | 2072 | Feb. 19 | 2092 | Feb. 7 | ||
| 2053 | Feb. 19 | 2073 | Feb. 7 | 2093 | Jan. 27 | ||
| 2054 | Feb. 8 | 2074 | Jan. 27 | 2094 | Feb. 15 | ||
| 2055 | Jan. 28 | 2075 | Feb. 15 | 2095 | Feb. 5 | ||
| 2056 | Feb. 15 | 2076 | Feb. 5 | 2096 | Jan. 25 | ||
| 2057 | Feb. 4 | 2077 | Jan. 24 | 2097 | Feb. 12 | ||
| 2058 | Jan. 24 | 2078 | Feb. 12 | 2098 | Feb. 1 | ||
| 2059 | Feb. 12 | 2079 | Feb. 2 | 2099 | Jan. 21 | ||
| 2100 | Feb. 9 | ||||||
For more details about the Lunar Calendar click here.
TOP HOME [◆ ROC calendar] [Lunar calendar]
Lantern Festival, Dragon Boat Festival, Ghost Festival, Mid-Autumn Festival 1900-2081
The following table shows the other four major holidays of the Lunar Calendar and their dates according to the Gregorian Calendar.
| Year | 1-15 | 5-5 | 7-15 | 8-15 | Year | 1-15 | 5-5 | 7-15 | 8-15 | |
|---|---|---|---|---|---|---|---|---|---|---|
| 1900 | Feb. 14 | June 1 | Aug. 9 | Sept. 8 | 1991 | March 1 | June 16 | Aug. 24 | Sept. 22 | |
| 1901 | March 5 | June 20 | Aug. 28 | Sept. 27 | 1992 | Feb. 18 | June 5 | Aug. 13 | Sept. 11 | |
| 1902 | Feb. 22 | June 10 | Aug. 18 | Sept. 16 | 1993 | Feb. 6 | June 24 | Sept. 1 | Sept. 30 | |
| 1903 | Feb. 12 | May 31 | Sept. 6 | Oct. 5 | 1994 | Feb. 24 | June 13 | Aug. 21 | Sept. 20 | |
| 1904 | March 1 | June 18 | Aug. 25 | Sept. 24 | 1995 | Feb. 14 | June 2 | Aug. 10 | Sept. 9 | |
| 1905 | Feb. 18 | June 7 | Aug. 15 | Sept. 13 | 1996 | March 4 | June 20 | Aug. 28 | Sept. 27 | |
| 1906 | Feb. 8 | June 26 | Sept. 3 | Oct. 2 | 1997 | Feb. 21 | June 9 | Aug. 17 | Sept. 16 | |
| 1907 | Feb. 27 | June 15 | Aug. 23 | Sept. 22 | 1998 | Feb. 11 | May 30 | Sept. 5 | Oct. 5 | |
| 1908 | Feb. 16 | June 3 | Aug. 11 | Sept. 10 | 1999 | March 2 | June 18 | Aug. 25 | Sept. 24 | |
| 1909 | Feb. 5 | June 22 | Aug. 30 | Sept. 28 | 2000 | Feb. 19 | June 6 | Aug. 14 | Sept. 12 | |
| 1910 | Feb. 24 | June 11 | Aug. 19 | Sept. 18 | 2001 | Feb. 7 | June 25 | Sept. 2 | Oct. 1 | |
| 1911 | Feb. 13 | June 1 | Sept. 7 | Oct. 6 | 2002 | Feb. 26 | June 15 | Aug. 23 | Sept. 21 | |
| 1912 | March 3 | June 19 | Aug. 27 | Sept. 25 | 2003 | Feb. 15 | June 4 | Aug. 12 | Sept. 11 | |
| 1913 | Feb. 20 | June 9 | Aug. 16 | Sept. 15 | 2004 | Feb. 5 | June 22 | Aug. 30 | Sept. 28 | |
| 1914 | Feb. 9 | May 29 | Sept. 4 | Oct. 4 | 2005 | Feb. 23 | June 11 | Aug. 19 | Sept. 18 | |
| 1915 | Feb. 28 | June 17 | Aug. 25 | Sept. 23 | 2006 | Feb. 12 | May 31 | Aug. 8 | Oct. 6 | |
| 1916 | Feb. 17 | June 5 | Aug. 13 | Sept. 12 | 2007 | March 4 | June 19 | Aug. 27 | Sept. 25 | |
| 1917 | Feb. 6 | June 23 | Sept. 1 | Sept. 30 | 2008 | Feb. 21 | June 8 | Aug. 15 | Sept. 14 | |
| 1918 | Feb. 25 | June 13 | Aug. 21 | Sept. 19 | 2009 | Feb. 9 | May 28 | Sept. 3 | Oct. 3 | |
| 1919 | Feb. 15 | June 2 | Aug. 10 | Oct. 8 | 2010 | Feb. 28 | June 16 | Aug. 24 | Sept. 22 | |
| 1920 | March 5 | June 20 | Aug. 28 | Sept. 26 | 2011 | Feb. 17 | June 6 | Aug. 14 | Sept. 12 | |
| 1921 | Feb. 22 | June 10 | Aug. 18 | Sept. 16 | 2012 | Feb. 6 | June 23 | Aug. 31 | Sept. 30 | |
| 1922 | Feb. 11 | May 31 | Sept. 6 | Oct. 5 | 2013 | Feb. 24 | June 13 | Aug. 21 | Sept. 19 | |
| 1923 | March 2 | June 18 | Aug. 26 | Sept. 25 | 2014 | Feb. 14 | June 2 | Aug. 10 | Sept. 8 | |
| 1924 | Feb. 19 | June 6 | Aug. 15 | Sept. 13 | 2015 | March 5 | June 20 | Aug. 28 | Sept. 27 | |
| 1925 | Feb. 7 | June 25 | Sept. 2 | Oct. 2 | 2016 | Feb. 22 | June 9 | Aug. 17 | Sept. 15 | |
| 1926 | Feb. 27 | June 14 | Aug. 22 | Sept. 21 | 2017 | Feb. 11 | May 30 | Sept. 5 | Oct. 4 | |
| 1927 | Feb. 16 | June 4 | Aug. 12 | Sept. 10 | 2018 | March 2 | June 18 | Aug. 25 | Sept. 24 | |
| 1928 | Feb. 6 | June 22 | Aug. 29 | Sept. 28 | 2019 | Feb. 19 | June 7 | Aug. 15 | Sept. 13 | |
| 1929 | Feb. 24 | June 11 | Aug. 19 | Sept. 17 | 2020 | Feb. 8 | June 25 | Sept. 2 | Oct. 1 | |
| 1930 | Feb. 13 | June 1 | Sept. 7 | Oct. 6 | 2021 | Feb. 26 | June 14 | Aug. 22 | Sept. 21 | |
| 1931 | March 3 | June 20 | Aug. 28 | Sept. 26 | 2022 | Feb. 15 | June 3 | Aug. 12 | Sept. 10 | |
| 1932 | Feb. 20 | June 8 | Aug. 16 | Sept. 15 | 2023 | Feb. 5 | June 22 | Aug. 30 | Sept. 29 | |
| 1933 | Feb. 9 | May 28 | Sept. 4 | Oct. 4 | 2024 | Feb. 24 | June 10 | Aug. 18 | Sept. 17 | |
| 1934 | Feb. 28 | June 16 | Aug. 24 | Sept. 23 | 2025 | Feb. 12 | May 30 | Sept. 6 | Oct. 6 | |
| 1935 | Feb. 18 | June 5 | Aug. 13 | Sept. 12 | 2026 | March 3 | June 19 | Aug. 27 | Sept. 25 | |
| 1936 | Feb. 7 | June 23 | Aug. 31 | Sept. 30 | 2027 | Feb. 20 | June 9 | Aug. 16 | Sept. 15 | |
| 1937 | Feb. 25 | June 12 | Aug. 20 | Sept. 18 | 2028 | Feb. 9 | May 28 | Sept. 3 | Oct. 3 | |
| 1938 | Feb. 13 | June 2 | Aug. 10 | Oct. 8 | 2029 | Feb. 27 | June 16 | Aug. 24 | Sept. 22 | |
| 1939 | March 5 | June 21 | Aug. 29 | Sept. 27 | 2030 | Feb. 17 | June 5 | Aug. 13 | Sept. 12 | |
| 1940 | Feb. 22 | June 10 | Aug. 18 | Sept. 16 | 2031 | Feb. 6 | June 24 | Sept. 1 | Oct. 1 | |
| 1941 | Feb. 10 | May 30 | Sept. 6 | Oct. 5 | 2032 | Feb. 25 | June 12 | Aug. 20 | Sept. 19 | |
| 1942 | March 1 | June 18 | Aug. 26 | Sept. 24 | 2033 | Feb. 14 | June 1 | Aug. 9 | Sept. 8 | |
| 1943 | Feb. 19 | June 7 | Aug. 15 | Sept. 14 | 2034 | March 5 | June 20 | Aug. 28 | Sept. 27 | |
| 1944 | Feb. 8 | June 25 | Sept. 2 | Oct. 1 | 2035 | Feb. 22 | June 10 | Aug. 18 | Sept. 16 | |
| 1945 | Feb. 27 | June 14 | Aug. 22 | Sept. 20 | 2036 | Feb. 11 | May 30 | Sept. 5 | Oct. 4 | |
| 1946 | Feb. 16 | June 4 | Aug. 11 | Sept. 10 | 2037 | March 1 | June 18 | Aug. 25 | Sept. 24 | |
| 1947 | Feb. 5 | June 23 | Aug. 30 | Sept. 29 | 2038 | Feb. 18 | June 7 | Aug. 15 | Sept. 13 | |
| 1948 | Feb. 24 | June 11 | Aug. 19 | Sept. 17 | 2039 | Feb. 7 | May 27 | Sept. 3 | Oct. 2 | |
| 1949 | Feb. 12 | June 1 | Aug. 9 | Oct. 6 | 2040 | Feb. 26 | June 14 | Aug. 22 | Sept. 20 | |
| 1950 | March 3 | June 19 | Aug. 28 | Sept. 26 | 2041 | Feb. 15 | June 3 | Aug. 11 | Sept. 10 | |
| 1951 | Feb. 20 | June 9 | Aug. 17 | Sept. 15 | 2042 | Feb. 5 | June 22 | Aug. 30 | Sept. 28 | |
| 1952 | Feb. 10 | May 28 | Sept. 3 | Oct. 3 | 2043 | Feb. 24 | June 11 | Aug. 19 | Sept. 17 | |
| 1953 | Feb. 28 | June 15 | Aug. 24 | Sept. 22 | 2044 | Feb. 13 | May 31 | Aug. 8 | Oct. 5 | |
| 1954 | Feb. 17 | June 5 | Aug. 13 | Sept. 11 | 2045 | March 3 | June 19 | Aug. 27 | Sept. 25 | |
| 1955 | Feb. 7 | June 24 | Sept. 1 | Sept. 30 | 2046 | Feb. 20 | June 8 | Aug. 16 | Sept. 15 | |
| 1956 | Feb. 26 | June 13 | Aug. 20 | Sept. 19 | 2047 | Feb. 9 | May 29 | Sept. 4 | Oct. 4 | |
| 1957 | Feb. 14 | June 2 | Aug. 10 | Sept. 8 | 2048 | Feb. 28 | June 15 | Aug. 24 | Sept. 22 | |
| 1958 | March 4 | June 21 | Aug. 29 | Sept. 27 | 2049 | Feb. 16 | June 4 | Aug. 13 | Sept. 11 | |
| 1959 | Feb. 22 | June 10 | Aug. 18 | Sept. 17 | 2050 | Feb. 6 | June 23 | Aug. 31 | Sept. 30 | |
| 1960 | Feb. 11 | May 29 | Sept. 5 | Oct. 5 | 2051 | Feb. 25 | June 13 | Aug. 20 | Sept. 19 | |
| 1961 | March 1 | June 17 | Aug. 25 | Sept. 24 | 2052 | Feb. 15 | June 1 | Aug. 9 | Sept. 7 | |
| 1962 | Feb. 19 | June 6 | Aug. 14 | Sept. 13 | 2053 | March 5 | June 20 | Aug. 28 | Sept. 26 | |
| 1963 | Feb. 8 | June 25 | Sept. 2 | Oct. 2 | 2054 | Feb. 22 | June 10 | Aug. 18 | Sept. 16 | |
| 1964 | Feb. 27 | June 14 | Aug. 22 | Sept. 20 | 2055 | Feb. 11 | May 30 | Sept. 6 | Oct. 5 | |
| 1965 | Feb. 16 | June 4 | Aug. 11 | Sept. 10 | 2056 | Feb. 29 | June 17 | Aug. 25 | Sept. 24 | |
| 1966 | Feb. 4 | June 23 | Aug. 30 | Sept. 29 | 2057 | Feb. 18 | June 6 | Aug. 14 | Sept. 13 | |
| 1967 | Feb. 23 | June 12 | Aug. 20 | Sept. 18 | 2058 | Feb. 7 | June 25 | Sept. 2 | Oct. 2 | |
| 1968 | Feb. 13 | May 31 | Aug. 8 | Oct. 6 | 2059 | Feb. 26 | June 14 | Aug. 22 | Sept. 21 | |
| 1969 | March 3 | June 19 | Aug. 27 | Sept. 26 | 2060 | Feb. 16 | June 3 | Aug. 10 | Sept. 9 | |
| 1970 | Feb. 20 | June 8 | Aug. 16 | Sept. 15 | 2061 | Feb. 4 | June 22 | Aug. 29 | Sept. 28 | |
| 1971 | Feb. 10 | May 28 | Sept. 4 | Oct. 3 | 2062 | Feb. 23 | June 11 | Aug. 19 | Sept. 17 | |
| 1972 | Feb. 29 | June 15 | Aug. 23 | Sept. 22 | 2063 | Feb. 12 | June 1 | Aug. 9 | Oct. 6 | |
| 1973 | Feb. 17 | June 5 | Aug. 13 | Sept. 11 | 2064 | March 2 | June 19 | Aug. 27 | Sept. 25 | |
| 1974 | Feb. 6 | June 24 | Sept. 1 | Sept. 30 | 2065 | Feb. 19 | June 8 | Aug. 16 | Sept. 15 | |
| 1975 | Feb. 25 | June 14 | Aug. 21 | Sept. 20 | 2066 | Feb. 9 | May 28 | Sept. 4 | Oct. 3 | |
| 1976 | Feb. 14 | June 2 | Aug. 10 | Sept. 8 | 2067 | Feb. 28 | June 16 | Aug. 24 | Sept. 23 | |
| 1977 | March 4 | June 21 | Aug. 29 | Sept. 27 | 2068 | Feb. 17 | June 4 | Aug. 12 | Sept. 11 | |
| 1978 | Feb. 21 | June 10 | Aug. 18 | Sept. 17 | 2069 | Feb. 6 | June 23 | Aug. 31 | Sept. 29 | |
| 1979 | Feb. 11 | May 30 | Sept. 6 | Oct. 5 | 2070 | Feb. 25 | June 13 | Aug. 20 | Sept. 19 | |
| 1980 | March 1 | June 17 | Aug. 25 | Sept. 23 | 2071 | Feb. 14 | June 2 | Aug. 10 | Sept. 8 | |
| 1981 | Feb. 19 | June 6 | Aug. 14 | Sept. 12 | 2072 | March 4 | June 20 | Aug. 28 | Sept. 26 | |
| 1982 | Feb. 8 | June 25 | Sept. 2 | Oct. 1 | 2073 | Feb. 21 | June 10 | Aug. 18 | Sept. 16 | |
| 1983 | Feb. 27 | June 15 | Aug. 23 | Sept. 21 | 2074 | Feb. 10 | May 30 | Sept. 5 | Oct. 5 | |
| 1984 | Feb. 16 | June 4 | Aug. 11 | Sept. 10 | 2075 | March 1 | June 17 | Aug. 26 | Sept. 24 | |
| 1985 | March 6 | June 22 | Aug. 30 | Sept. 29 | 2076 | Feb. 19 | June 6 | Aug. 14 | Sept. 12 | |
| 1986 | Feb. 23 | June 11 | Aug. 20 | Sept. 18 | 2077 | Feb. 7 | June 24 | Sept. 1 | Oct. 1 | |
| 1987 | Feb. 12 | May 31 | Sept. 7 | Oct. 7 | 2078 | Feb. 26 | June 14 | Aug. 22 | Sept. 20 | |
| 1988 | March 2 | June 18 | Aug. 26 | Sept. 25 | 2079 | Feb. 16 | June 4 | Aug. 11 | Sept. 10 | |
| 1989 | Feb. 20 | June 8 | Aug. 15 | Sept. 14 | 2080 | Feb. 5 | June 22 | Aug. 29 | Sept. 28 | |
| 1990 | Feb. 10 | May 28 | Sept. 3 | Oct. 3 | 2081 | Feb. 23 | June 11 | Aug. 19 | Sept. 17 |
TOP HOME [◆ ROC calendar] [Lunar calendar]
The Ganzhi cycle and its terminology
China's lunar calendar consists of a 60-year cycle based on the ganzhi 干支 system. Ganzhi literally means "stem branch" and stands for a combination of the "Ten Heavenly Stems" (tiangan 天干) with the "Twelve Earthly Branches" (dizhi 地支).
The Ten Heavenly Stems represent the Five Primary Elements (wuxing 五行)—wood (mu 木), fire (huo 火), earth (tu 土), metal (jin 金), and water (shui 水)—with their respective Yin (陰) or Yang (陽) aspect:
| 1. jia 甲 | = | Yang wood | 
| 6. ji 己 | = | Yin earth |
| 2. yi 乙 | = | Yin wood | 7. geng 庚 | = | Yang metal | |
| 3. bing 丙 | = | Yang fire | 8. xin 辛 | = | Yin metal | |
| 4. ding 丁 | = | Yin fire | 9. ren 壬 | = | Yang water | |
| 5. wu 戊 | = | Yang earth | 10. gui 癸 | = | Yin water |
The Ten Heavenly Stems are also common as a numbering system in official documents and academic papers (like a, b, c, etc. in English). Information about another subtopic in the context of the Yin and Yang duality can be found here.
The Twelve Earthly Branches represent the 12 animals signs of the Chinese zodiac (shengxiao 生肖):
| zi 子 | = | Rat (shu 鼠) | 
| wu 午 | = | Horse (ma 馬) |
| chou 丑 | = | Ox (niu 牛) | wei 未 | = | Sheep (yang 羊) | |
| yin 寅 | = | Tiger (hu 虎) | shen 申 | = | Monkey (hou 猴) | |
| mao 卯 | = | Rabbit (tu 兔) | you 酉 | = | Rooster (ji 雞) | |
| chen 辰 | = | Dragon (long 龍) | xu 戌 | = | Dog (gou 狗) | |
| si 巳 | = | Snake (she 蛇) | hai 亥 | = | Pig (zhu 豬) |
The combination of the two sequences produces the 60-year Ganzhi cycle which is presented in the table directly below. Because the number of characters in each sequence is even, each zodiac sign always comes with the same Yin/Yang aspect. Yang zodiac signs: Rat, Tiger, Dragon, Horse, Monkey, Dog; Yin zodiac signs: Ox, Rabbit, Snake, Sheep, Rooster, Pig. Please note that the terms in the column "Meaning" are actually reversed—while the Chinese Ganzhi term shows the stem (element with Yin/Yang aspect) first, followed by the branch (zodiac sign), in the table the zodiac sign is named first.
| Ganzhi | Meaning | Years (A. D.) | |
|---|---|---|---|
| gengzi 庚子 | Rat | Yang metal | ... 1780, 1840, 1900, 1960, 2020, 2080, ... |
| xinchou 辛丑 | Ox | Yin metal | ... 1781, 1841, 1901, 1961, 2021, 2081, ... |
| renyin 壬寅 | Tiger | Yang water | ... 1782, 1842, 1902, 1962, 2022, 2082, ... |
| guimao 癸卯 | Rabbit | Yin water | ... 1783, 1843, 1903, 1963, 2023, 2083, ... |
| jiachen 甲辰 | Dragon | Yang wood | ... 1784, 1844, 1904, 1964, 2024, 2084, ... |
| yisi 乙巳 | Snake | Yin wood | ... 1785, 1845, 1905, 1965, 2025, 2085, ... |
| bingwu 丙午 | Horse | Yang fire | ... 1786, 1846, 1906, 1966, 2026, 2086, ... |
| dingwei 丁未 | Sheep | Yin fire | ... 1787, 1847, 1907, 1967, 2027, 2087, ... |
| wushen 戊申 | Monkey | Yang earth | ... 1788, 1848, 1908, 1968, 2028, 2088, ... |
| jiyou 己酉 | Rooster | Yin earth | ... 1789, 1849, 1909, 1969, 2029, 2089, ... |
| gengxu 庚戌 | Dog | Yang metal | ... 1790, 1850, 1910, 1970, 2030, 2090, ... |
| xinhai 辛亥 | Pig | Yin metal | ... 1791, 1851, 1911, 1971, 2031, 2091, ... |
| renzi 壬子 | Rat | Yang water | ... 1792, 1852, 1912, 1972, 2032, 2092, ... |
| guichou 癸丑 | Ox | Yin water | ... 1793, 1853, 1913, 1973, 2033, 2093, ... |
| jiayin 甲寅 | Tiger | Yang wood | ... 1794, 1854, 1914, 1974, 2034, 2094, ... |
| yimao 乙卯 | Rabbit | Yin wood | ... 1795, 1855, 1915, 1975, 2035, 2095, ... |
| bingchen 丙辰 | Dragon | Yang fire | ... 1796, 1856, 1916, 1976, 2036, 2096, ... |
| dingsi 丁巳 | Snake | Yin fire | ... 1797, 1857, 1917, 1977, 2037, 2097, ... |
| wuwu 戊午 | Horse | Yang earth | ... 1798, 1858, 1918, 1978, 2038, 2098, ... |
| jiwei 己未 | Sheep | Yin earth | ... 1799, 1859, 1919, 1979, 2039, 2099, ... |
| gengshen 庚申 | Monkey | Yang metal | ... 1800, 1860, 1920, 1980, 2040, 2100, ... |
| xinyou 辛酉 | Rooster | Yin metal | ... 1801, 1861, 1921, 1981, 2041, 2101, ... |
| renxu 壬戌 | Dog | Yang water | ... 1802, 1862, 1922, 1982, 2042, 2102, ... |
| guihai 癸亥 | Pig | Yin water | ... 1803, 1863, 1923, 1983, 2043, 2103, ... |
| jiazi 甲子 | Rat | Yang wood | ... 1804, 1864, 1924, 1984, 2044, 2104, ... |
| yichou 乙丑 | Ox | Yin wood | ... 1805, 1865, 1925, 1985, 2045, 2105, ... |
| bingyin 丙寅 | Tiger | Yang fire | ... 1806, 1866, 1926, 1986, 2046, 2106, ... |
| dingmao 丁卯 | Rabbit | Yin fire | ... 1807, 1867, 1927, 1987, 2047, 2107, ... |
| wuchen 戊辰 | Dragon | Yang earth | ... 1808, 1868, 1928, 1988, 2048, 2108, ... |
| jisi 己巳 | Snake | Yin earth | ... 1809, 1869, 1929, 1989, 2049, 2109, ... |
| gengwu 庚午 | Horse | Yang metal | ... 1810, 1870, 1930, 1990, 2050, 2110, ... |
| xinwei 辛未 | Sheep | Yin metal | ... 1811, 1871, 1931, 1991, 2051, 2111, ... |
| renshen 壬申 | Monkey | Yang water | ... 1812, 1872, 1932, 1992, 2052, 2112, ... |
| guiyou 癸酉 | Rooster | Yin water | ... 1813, 1873, 1933, 1993, 2053, 2113, ... |
| jiaxu 甲戌 | Dog | Yang wood | ... 1814, 1874, 1934, 1994, 2054, 2114, ... |
| yihai 乙亥 | Pig | Yin wood | ... 1815, 1875, 1935, 1995, 2055, 2115, ... |
| bingzi 丙子 | Rat | Yang fire | ... 1816, 1876, 1936, 1996, 2056, 2116, ... |
| dingchou 丁丑 | Ox | Yin fire | ... 1817, 1877, 1937, 1997, 2057, 2117, ... |
| wuyin 戊寅 | Tiger | Yang earth | ... 1818, 1878, 1938, 1998, 2058, 2118, ... |
| jimao 己卯 | Rabbit | Yin earth | ... 1819, 1879, 1939, 1999, 2059, 2119, ... |
| gengchen 庚辰 | Dragon | Yang metal | ... 1820, 1880, 1940, 2000, 2060, 2120, ... |
| xinsi 辛巳 | Snake | Yin metal | ... 1821, 1881, 1941, 2001, 2061, 2121, ... |
| renwu 壬午 | Horse | Yang water | ... 1822, 1882, 1942, 2002, 2062, 2122, ... |
| guiwei 癸未 | Sheep | Yin water | ... 1823, 1883, 1943, 2003, 2063, 2123, ... |
| jiashen 甲申 | Monkey | Yang wood | ... 1824, 1884, 1944, 2004, 2064, 2124, ... |
| yiyou 乙酉 | Rooster | Yin wood | ... 1825, 1885, 1945, 2005, 2065, 2125, ... |
| bingxu 丙戌 | Dog | Yang fire | ... 1826, 1886, 1946, 2006, 2066, 2126, ... |
| dinghai 丁亥 | Pig | Yin fire | ... 1827, 1887, 1947, 2007, 2067, 2127, ... |
| wuzi 戊子 | Rat | Yang earth | ... 1828, 1888, 1948, 2008, 2068, 2128, ... |
| jichou 己丑 | Ox | Yin earth | ... 1829, 1889, 1949, 2009, 2069, 2129, ... |
| gengyin 庚寅 | Tiger | Yang metal | ... 1830, 1890, 1950, 2010, 2070, 2130, ... |
| xinmao 辛卯 | Rabbit | Yin metal | ... 1831, 1891, 1951, 2011, 2071, 2131, ... |
| renchen 壬辰 | Dragon | Yang water | ... 1832, 1892, 1952, 2012, 2072, 2132, ... |
| guisi 癸巳 | Snake | Yin water | ... 1833, 1893, 1953, 2013, 2073, 2133, ... |
| jiawu 甲午 | Horse | Yang wood | ... 1834, 1894, 1954, 2014, 2074, 2134, ... |
| yiwei 乙未 | Sheep | Yin wood | ... 1835, 1895, 1955, 2015, 2075, 2135, ... |
| bingshen 丙申 | Monkey | Yang fire | ... 1836, 1896, 1956, 2016, 2076, 2136, ... |
| dingyou 丁酉 | Rooster | Yin fire | ... 1837, 1897, 1957, 2017, 2077, 2137, ... |
| wuxu 戊戌 | Dog | Yang earth | ... 1838, 1898, 1958, 2018, 2078, 2138, ... |
| jihai 己亥 | Pig | Yin earth | ... 1839, 1899, 1959, 2019, 2079, 2139, ... |
Notes: The First Chinese-Japanese War which broke out in 1894 is called Jiawu zhanzheng 甲午戰爭 in Chinese because that year had the ganzhi designation jiawu 甲午 (i. e. year of the Horse, element wood, aspect Yang). The name of the 1911 Hsinhai Revolution (xinhai geming 辛亥革命) refers to the ganzhi designation xinhai 辛亥 (year of the Pig, element metal, aspect Yin) of that year.
TOP HOME [◆ ROC calendar] [Ganzhi cycle]
Yin and Yang ☯, the Book of Changes, trigrams and hexagrams
 The Yin and Yang duality which manifests itself in the Ten Heavenly Stems
was already present in ancient oracles that used oracle bones (jiagu 甲骨) or milfoil stalks (shicao 蓍草) for
divination. An unbroken line (⚊) stands for "yes" as well as for Yang 陽, a broken line (⚋) means "no" or Yin 陰.
Many scholars believe that a divination required six questions that rendered six answers. Those six answers of Yes or No were combined
and resulted in six lines, creating a hexagram. There are altogether 64 possibilities of different hexagrams.
The Yin and Yang duality which manifests itself in the Ten Heavenly Stems
was already present in ancient oracles that used oracle bones (jiagu 甲骨) or milfoil stalks (shicao 蓍草) for
divination. An unbroken line (⚊) stands for "yes" as well as for Yang 陽, a broken line (⚋) means "no" or Yin 陰.
Many scholars believe that a divination required six questions that rendered six answers. Those six answers of Yes or No were combined
and resulted in six lines, creating a hexagram. There are altogether 64 possibilities of different hexagrams.
The textual comments on these hexagrams were compiled in the Book of Changes (yijing 易經), one of Confucianism's Five Classics (wujing 五經), which used to serve as an oracular tool and offers a condensed description of the cosmos. In the Book of Changes, a hexagram is not seen as a single unit, but as a combination of two trigrams.
 There are altogether 8 possibilities of different trigrams. These eight trigrams (bagua 八卦) consist of
three lines each which, like in the hexagrams, can be broken or unbroken. According to legend, the eight trigrams were invented by
the mythical emperor Fuxi 伏羲.
There are altogether 8 possibilities of different trigrams. These eight trigrams (bagua 八卦) consist of
three lines each which, like in the hexagrams, can be broken or unbroken. According to legend, the eight trigrams were invented by
the mythical emperor Fuxi 伏羲.
The tables below show the 8 trigrams and 64 hexagrams, their stacks of lines supposed to be read from the bottom upwards. The order of the trigrams as listed here is consistent with their appearance in the list of the 64 hexagrams, although it may vary from source to source. Trigrams and hexagrams are both called gua 卦 in Chinese.
8 Trigrams
| Trigram | qian 乾 | kun 坤 | kan 坎 | li 離 | zhen 震 | gen 艮 | sun/xun 巽 | dui 兌 |
|---|---|---|---|---|---|---|---|---|
| Yes ⚊ / No ⚋ | ☰ | ☷ | ☵ | ☲ | ☳ | ☶ | ☴ | ☱ |
| Symbolizes... | Heaven 天 | Earth 地 | Water 水 | Fire 火 | Thunder 雷 | Hills 山 | Wind 風 | Lakes 澤 |
| Family member | Father | Mother | Middle son | Middle daughter | Eldest son | Youngest son | Eldest daughter | Youngest daughter |
| Direction | S 南 | N 北 | W 西 | E 東 | NE 東北 | NW 西北 | SW 西南 | SE 東南 |
| Yin 陰 / Yang 陽 | Yang | Yin | Yang | Yin | Yang | Yang | Yin | Yin |
| Hexagram No. | 1 | 2 | 29 | 30 | 51 | 52 | 57 | 58 |
64 hexagrams
The last two rows in each block offer translations for the terms, the terms in the second row provided by Wikipedia.
| 1. qian 乾 | 2. kun 坤 | 3. zhun 屯 | 4. meng 蒙 | 5. xu 需 | 6. song 松 | 7. shi 師 | 8. bi 比 |
| Creative heaven | Receptive earth | Difficulty at the beginning | Youthful folly | Waiting | Conflict | Army | Holding together |
| Force | Field | Sprouting | Enveloping | Attending | Arguing | Leading | Grouping |
| 9. xiaochu 小畜 | 10. fu 履 | 11. tai 泰 | 12. pi 否 | 13. tongren 同人 | 14. dayou 大有 | 15. qian 謙 | 16. yu 豫 |
| Small taming | Treading | Peace | Standstill | Fellowship | Great possession | Modesty | Enthusiasm |
| Small harvest | Treading | Pervading | Obstruction | Concording people | Great possessing | Humbling | Providing for |
| 17. sui 隨 | 18. gu 蠱 | 19. lin 臨 | 20. guan 觀 | 21. shike 噬嗑 | 22. bi 賁 | 23. bo 剝 | 24. fu 復 |
| Following | Work on the decayed | Approach | Contemplation | Biting through | Grace | Splitting apart | Return |
| Following | Correcting | Nearing | Viewing | Gnawing bite | Adorning | Stripping | Returning |
| 25. wuwang 无妄 | 26. dachu 大畜 | 27. yi 頤 | 28. daguo 大過 | 29. kan 坎 | 30. li 離 | 31. xian 咸 | 32. heng 恒 |
| Innocence | Great taming | Mouth corners | Great preponderence | Abysmal water | Clinging fire | Influence | Duration |
| Innocence | Great accumulating | Swallowing | Great exceeding | Gorge | Radiance | Conjoining | Persevering |
| 33. dun 遯 | 34. dazhuang 大壯 | 35. jin 晉 | 36. mingyi 明夷 | 37. jiaren 家人 | 38. kui 睽 | 39. jian 蹇 | 40. jie 解 |
| Retreat | Great power | Progress | Darkening of the light | Family | Opposition | Obstruction | Deliverance |
| Retiring | Great invigorating | Prospering | Intelligence hidden | Dwelling people | Polarising | Limping | Deliverance |
| 41. sun 損 | 42. yi 益 | 43. guai 夬 | 44. gou 姤 | 45. cui 萃 | 46. sheng 升 | 47. kun 困 | 48. jing 井 |
| Decrease | Increase | Breakthrough | Coming to meet | Gathering together | Pushing upward | Oppression | The well |
| Diminishing | Augmenting | Displacement | Coupling | Clustering | Ascending | Confining | Welling |
| 49. ge 革 | 50. ding 鼎 | 51. zhen 震 | 52. gen 艮 | 53. jian 漸 | 54. guimei 歸妹 | 55. feng 豐 | 56. lü 旅 |
| Revolution | Cauldron | Arousing thunder | Keeping still mountain | Development | Marrying maiden | Abundance | Wanderer |
| Skinning | Holding | Shake | Bound | Infiltrating | Converting the maiden | Abounding | Sojourning |
| 57. xun 巽 | 58. dui 兌 | 59. huan 渙 | 60. jie 節 | 61. zhongfu 中孚 | 62. xiaoguo 小過 | 63. jiji 既濟 | 64. weiji 未濟 |
| Gentle wind | Joyous lake | Dispersion | Limitation | Inner truth | Small preponderance | After completion | Before completion |
| Ground | Open | Dispersing | Articulating | Inner truth | Small exceeding | Already fording | Before completion |
Alternative listing order of the 64 hexagrams
While above table is following the order of the hexagram's number, another method for listing the 64 hexagrams is common as well, based on the respective hexagram's composition of two trigrams as shown below.
| Upper → Lower ↓ |
☰ | ☱ | ☲ | ☳ | ☴ | ☵ | ☶ | ☷ |
|---|---|---|---|---|---|---|---|---|
| ☰ | ||||||||
| ☱ | ||||||||
| ☲ | ||||||||
| ☳ | ||||||||
| ☴ | ||||||||
| ☵ | ||||||||
| ☶ | ||||||||
| ☷ |
The twelve animal signs in the Chinese zodiac have hexagrams assigned to them as well.
| Rat | 24 [䷗] | Tiger | 11 [䷊] | Dragon | 43 [䷪] | Horse | 44 [䷫] | Monkey | 12 [䷋] | Dog | 23 [䷖] | |||||
| Ox | 19 [䷒] | Rabbit | 34 [䷡] | Snake | 1 [䷀] | Sheep | 33 [䷠] | Rooster | 20 [䷓] | Pig | 2 [䷁] |
TOP HOME [◆ ROC calendar] [8 trigrams, 64 hexagrams]
Overview of holidays in the ROC
In the course of the year, numerous holidays are celebrated in the ROC. Holidays based on cultural traditions are mostly observed according to the Lunar Calendar, while dates of holidays based on political or modern social events are usually determined following the Gregorian Calendar. Public holidays in the tables below are marked with a "✿". Since 2015, any public holiday that falls on the weekend has the preceding or following workday designated as day off in compensation.
Holidays according to the Gregorian Calendar
| Date | Holiday | Remarks |
|---|---|---|
| Jan. 1 | ROC Founding Day (Zhonghua minguo kaiguo jinianri 中華民國開國紀念日) | ✿ |
| Jan. 11 | Judicial Day (sifajie 司法節) aka Justice Day | |
| Jan. 19 | Firefighters' Day (xiaofangjie 消防節) | |
| Feb. 28 | Peace Memorial Day (ererba heping jinianri 二二八和平紀念日) | ✿ Was declared a public holiday in 1997 |
| March 8 | Women's Day (funüjie 婦女節) | |
| March 12 | Arbor Day (zhishujie 植樹節) | Was also observed as Day of Dr. Sun Yat-sen's Passing (guofu shishi jinianri 國父逝世紀念日) |
| March 29 | Youth Day (qingnianjie 青年節) | Sometimes also referred to in English as Martyr's Day |
| April 4 | Children's Day (ertongjie 兒童節) | ✿ |
| April 5 | Tomb Sweeping Day (qingmingjie 清明節 aka saomujie 掃墓節) | ✿ |
| April 7 | Freedom of Expression Day (yanlun ziyouri 言論自由日) | Observed since 2017 to commemorate the death of Nylon Cheng 鄭南榕 |
| April 20 | Gender Equality Education Day (xingbie pingdeng jiaoyuri 性別平等教育日) | Observed since 2022 |
| May 1 | Labour Day (laodongjie 勞動節) | ✿ |
| May 4 | Literary Day (wenyijie 文藝節) | |
| May 19 | White Terror Memorial Day (baise kongbu jiyiri 白色恐怖記憶日) | |
| June 3 | Opium Suppression Movement Day (jinyanjie 禁菸節) | |
| June 8 | National Ocean Day (guojia haiyangjie 國家海洋節) | |
| June 15 | National Police Day (jingchajie 警察節) | |
| Aug. 1 | Indigenous People's Day (Taiwan yuanzhu minzuri 台灣原住民族日 | |
| Aug. 8 | Father's Day (fuqinjie 父親節 aka babajie 八八節 / 爸爸節) | |
| Sept. 1 | Journalists Day (jizhejie 記者節) | |
| Sept. 3 | Armed Forces Day (junrenjie 軍人節) | |
| Sept. 9 | National Sports Day (guomin tiyuri 國民體育日) | |
| Sept. 28 | Teacher's Day (jiaoshijie 教師節) | ✿ Also celebrated as Confucius' Birthday (Kongzi danchen jinianri 孔子誕辰紀念日) |
| Oct. 5 | Taiwan Leopard Cat Day (Taiwan shihuri 台灣石虎日) | |
| Oct. 10 | National Day (guoqingri 國慶日 aka shuangshijie 雙十節) | ✿ |
| Oct. 21 | Overseas Chinese Day (huaqiaojie 華僑節) | |
| Oct. 25 | Taiwan Retrocession Day (Taiwan guangfujie 台灣光復節) | ✿ Also observed as Garbage Man Day (qingjie duiyuanri 清潔隊員節) |
| Oct. 31 | Chiang Kai-shek's Birthday (xian zongtong Jiang gong danchen jinianri 先總統蔣公誕辰紀念日) | Cancelled as a holiday in 2007 |
| Nov. 8 | Coast Guard Day (haixunjie 海巡節) | |
| Nov. 12 | Sun Yat-sen Birthday (guofu danchen jinianri 國父誕辰紀念日) | Was also observed as Cultural Renaissance Day (Zhonghua wenhua fuxingjie 中華文化復興節); cancelled as a holiday in 2016 |
| Dec. 25 | Constitution Day (xingxian jinianri 行憲紀念日) | ✿ |
Notes
The date of Tomb Sweeping Day may vary as it is celebrated on the 15th day after the spring equinox (aka vernal
equinox). Between 1975 and 2007 April 5 was also observed as Anniversary of Chiang Kai-shek's Passing (xian
zongtong Jiang gong shishi jinianri 先總統蔣公逝世紀念日).
Furthermore, there are other holidays with non-fixed dates according to the Gregorian Calendar, e. g. Farmers Day (nongminjie 農民節) which is observed at the beginning of spring, Mother's Day (muqinjie 母親節) on the second Sunday in May, and the Tung Chih Festival which is observed on the winter solstice.
On May 9, 2025 the ROC Legislative Yuan passed a law that adds Confucius' Birthday/Teacher's Day on Sept. 28, the anniversary of the Battle of Guningtou (Taiwan guangfu ji Jinmen Guningtou dajie jinianri 台灣光復暨金門古寧頭大捷紀念日) on Oct. 25, Constitution Day on Dec. 25 and Little New Year (xiaonianye 小年夜)—the day before Lunar New Year's Eve—as national holidays, as well as making Labour Day/Workers' Day on May 1 a national holiday for all sectors, not just for blue-collar workers.
Eight astronomical events of the solar system—the beginning dates of the four seasons, the equinoxes and the solstices—are sometimes referred to as "Eight Festivals" (bajie 八節). The dates shown in the table directly below may vary depending on the year.
| Date | Event | Date | Event | |
|---|---|---|---|---|
| Feb. 5 | Spring begins (lichun 立春) | March 20 | Spring equinox (chunfen 春分) | |
| May 5 | Summer begins (lixia 立夏) | June 20/21 | Summer solstice (xiazhi 夏至) | |
| Aug. 7 | Autumn begins (liqiu 立秋) | Sept. 22/23 | Autumnal equinox (qiufen 秋分) | |
| Nov. 7 | Winter begins (lidong 立冬) | Dec. 21/22 | Winter solstice (dongzhi 冬至) |
TOP HOME [◆ ROC calendar] [ROC holidays]
Holidays according to the Lunar Calendar
Dates of the Lunar Calendar are shown here like this—"1-15" stands for the fifteenth day of the first lunar month.
| Date | Holiday | Remarks |
|---|---|---|
| 1-1 | Lunar New Year (guonian 過年 / chunjie 春節) | ✿ |
| 1-15 | Lantern Festival (yuanxiaojie 元宵節) | Also celebrated as Tourism Day (guanguangjie 觀光節) |
| 2-2 | Earth God's Birthday (tudigong danchen 土地公誕辰) | |
| 2-19 | Guan Yin's Birthday (Guanyin danchen 觀音誕辰) | Guan Yin is also known as the Goddess of Mercy |
| 3-15 | God of Medicine's Birthday (baosheng dadi danchen 保生大帝誕辰) | |
| 3-23 | Matsu's Birthday (Mazu danchen 媽祖誕辰 / tianhou baodan 天后寶誕) | Matsu or Lin Moniang 林默娘 (960-987 CE) is revered as Goddess of the Sea |
| 4-8 | Buddha's Birthday (fo danchen 佛誕辰) | |
| 5-5 | Dragon Boat Festival (duanwujie 端午節) | ✿ |
| 5-13 | Guan Gong's Birthday (Guan Gong danchen 關公誕辰) | Guan Gong aka Guan Yu 關羽 (162-220 CE), a historical figure, was a general and is sometimes called the God of War; the holiday is also sometimes referred to as "Cheng Huang's Birthday" (Cheng Huang ye danchen 城隍爺誕辰) |
| 7-7 | Double Seventh Festival (qixi 七夕) aka Qixi Festival (qixijie 七夕節) | Chinese Valentine's Day |
| 7-14 | Koxinga's Birthday (Zheng Chenggong danchen 鄭成功誕辰) | |
| 7-15 | Ghost Festival (zhongyuanjie 中元節) | |
| 8-15 | Mid-Autumn Festival (zhongqiujie 中秋節) | ✿ Sometimes also referred to in English as "Moon Festival" |
| 9-9 | Double Ninth Festival (chongjiu 重九 / chongyangjie 重陽節) | |
| 10-15 | Xia Yuan Festival (xiayuanjie 下元節) | Emperor Yu's Birthday—the legendary Yu the Great 大禹 is traditionally worshipped the founder of the Xia Dynasty 夏 who "conquered the flood"; on that day the indigenous Saisiat Festival (saixiajie 賽夏節) is also celebrated in Taiwan |
| 12-23 | Kitchen God Festival (jizaojie 祭灶節) | |
| 12-28/29 | Little New Year (xiaonianye 小年夜) | ✿ |
| 12-29/30 | Lunar New Year's Eve (nongli chuxi 農曆除夕) | ✿ |
Whether Little New Year is on 12-28 or 12-29 (second last day of the twelfth lunar month), and Lunar New Year's Eve on 12-29 or 12-30 (last day of the twelfth lunar month), depends on whether that month is a short one with 29 days or a long one with 30 days. For a short but concise explanation of short/long lunar months and the basics of the lunar calendar click here.
According to the Republic of China Yearbook 1989 (p. 774), Koxinga's Birthday falls on 1-16 of the Lunar Calendar.
TOP HOME [◆ ROC calendar] [ROC holidays]
===== ===== ===== ===== =====
◆ The sound of Mandarin Chinese
++++++++++ TOP HOME [next chapter] [previous chapter] ++++++++++
The international standard adopted by the UN for the Romanization of Mandarin Chinese is Hanyu Pinyin. Under that system, Mandarin Chinese has 416 different syllables (variations under the four tones not counted). The number of syllables under each letter is as follows.
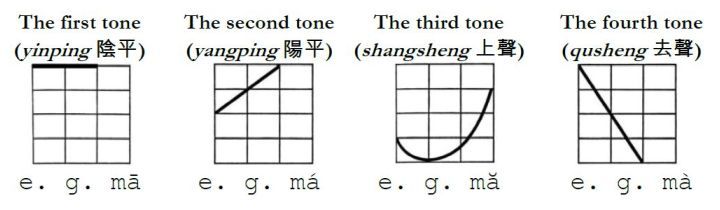
| A | 5 | F | 9 | L | 26 | Q | 14 | X | 14 | ||||
| B | 16 | G | 19 | M | 20 | R | 14 | Y | 16 | ||||
| C | 35 | H | 21 | N | 26 | S | 35 | Z | 37 | ||||
| D | 23 | J | 14 | O | 2 | T | 19 | ||||||
| E | 6 | K | 19 | P | 17 | W | 9 | ||||||
The following table shows the Romanization of Mandarin Chinese syllables under three different systems: Hanyu Pinyin, Wade Giles, and Tongyong, then the transliteration according to the Mandarin Phonetic Symbols (zhuyin fuhao 注音符號, abbrev. MPS) plus the description of the sounds according to the International Phonetic Alphabet (guoji yinbiao 國際音標, abbrev. IPA). The table follows the alphabetical order as under Hanyu Pinyin.
| Hanyu Pinyin | Wade Giles | Tongyong | MPS | IPA |
|---|---|---|---|---|
| —A— (5 syllables) 🏠 ⤒ [416] | ||||
| a | ah | a | ㄚ | a |
| ai | ai | ai | ㄞ | aɪ |
| an | an | an | ㄢ | an |
| ang | ang | ang | ㄤ | ɑŋ |
| ao | ao | ao | ㄠ | aʊ |
| —B— (16 syllables) 🏠 ⤒ [416] | ||||
| ba | pa | ba | ㄅㄚ | pa |
| bai | pai | bai | ㄅㄞ | paɪ |
| ban | pan | ban | ㄅㄢ | pan |
| bang | pang | bang | ㄅㄤ | pɑŋ |
| bao | pao | bao | ㄅㄠ | paʊ |
| bei | pei | bei | ㄅㄟ | pei |
| ben | pen | ben | ㄅㄣ | pən |
| beng | peng | beng | ㄅㄥ | pɤŋ |
| bi | pi | bi | ㄅㄧ | pi |
| bian | pien | bian | ㄅㄧㄢ | piɛn |
| biao | piao | biao | ㄅㄧㄠ | piaʊ |
| bie | pieh | bie | ㄅㄧㄝ | piɛ |
| bin | pin | bin | ㄅㄧㄣ | pin |
| bing | ping | bing | ㄅㄧㄥ | piŋ |
| bo | po | bo | ㄅㄛ | po |
| bu | pu | bu | ㄅㄨ | pu |
| —C— (35 syllables) 🏠 ⤒ [416] | ||||
| ca | ts'a | ca | ㄘㄚ | tsʰa |
| cai | ts'ai | cai | ㄘㄞ | tsʰaɪ |
| can | ts'an | can | ㄘㄢ | tsʰan |
| cang | ts'ang | cang | ㄘㄤ | tsʰɑŋ |
| cao | ts'ao | cao | ㄘㄠ | tsʰaʊ |
| ce | ts'e | ce | ㄘㄜ | tsʰɤ |
| cen | ts'en | cen | ㄘㄣ | tsʰən |
| ceng | ts'eng | ceng | ㄘㄥ | tsʰɤŋ |
| cha | ch'a | cha | ㄔㄚ | tʂʰa |
| chai | ch'ai | chai | ㄔㄞ | tʂʰaɪ |
| chan | ch'an | chan | ㄔㄢ | tʂʰan |
| chang | ch'ang | chang | ㄔㄤ | tʂʰɑŋ |
| chao | ch'ao | chao | ㄔㄠ | tʂʰaʊ |
| che | ch'e | che | ㄔㄜ | tʂʰɤ |
| chen | ch'en | chen | ㄔㄣ | tʂʰən |
| cheng | ch'eng | cheng | ㄔㄥ | tʂʰɤŋ |
| chi | ch'ih | chih | ㄔ | tʂʰɭ |
| chong | ch'ung | chong | ㄔㄨㄥ | tʂʰuəŋ |
| chou | ch'ou | chou | ㄔㄡ | tʂʰoʊ |
| chu | ch'u | chu | ㄔㄨ | tʂʰu |
| chua | ch'ua | chua | ㄔㄨㄚ | tʂʰuɑ |
| chuai | ch'uai | chuai | ㄔㄨㄞ | tʂʰuai |
| chuan | ch'uan | chuan | ㄔㄨㄢ | tʂʰuan |
| chuang | ch'uang | chuang | ㄔㄨㄤ | tʂʰuɑŋ |
| chui | ch'ui | chuei | ㄔㄨㄟ | tʂʰuei |
| chun | ch'un | chun | ㄔㄨㄣ | tʂʰuən |
| chuo | ch'uo / ch’o | chuo | ㄔㄨㄛ | tʂʰuo |
| ci | tz'u | cih | ㄘ | tsʰɻ |
| cong | ts'ung | cong | ㄘㄨㄥ | tsʰuəŋ |
| cou | ts'ou | cou | ㄘㄡ | tsʰoʊ |
| cu | ts'u | cu | ㄘㄨ | tsʰu |
| cuan | ts'uan | cuan | ㄘㄨㄢ | tsʰuan |
| cui | ts'ui | cuei | ㄘㄨㄟ | tsʰuei |
| cun | ts'un | cun | ㄘㄨㄣ | tsʰuən |
| cuo | ts'o | cuo | ㄘㄨㄛ | tsʰuo |
| —D— (23 syllables) 🏠 ⤒ [416] | ||||
| da | ta | da | ㄉㄚ | ta |
| dai | tai | dai | ㄉㄞ | taɪ |
| dan | tan | dan | ㄉㄢ | tan |
| dang | tang | dang | ㄉㄤ | tɑŋ |
| dao | tao | dao | ㄉㄠ | taʊ |
| de | te | de | ㄉㄜ | tɤ |
| dei | tei | dei | ㄉㄟ | tei |
| den | ten | den | ㄉㄣ | tən |
| deng | teng | deng | ㄉㄥ | tɤŋ |
| di | ti | di | ㄉㄧ | ti |
| dia | tia | dia | ㄉㄧㄚ | tiɑ |
| dian | tien | dian | ㄉㄧㄢ | tiɛn |
| diao | tiao | diao | ㄉㄧㄠ | tiaʊ |
| die | tieh | die | ㄉㄧㄝ | tiɛ |
| ding | ting | ding | ㄉㄧㄥ | tiŋ |
| diu | tiu | diou | ㄉㄧㄡ | tioʊ |
| dong | tung | dong | ㄉㄨㄥ | tuəŋ |
| dou | tou | dou | ㄉㄡ | toʊ |
| du | tu | du | ㄉㄨ | tu |
| duan | tuan | duan | ㄉㄨㄢ | tuan |
| dui | tui | duei | ㄉㄨㄟ | tuei |
| dun | tun | dun | ㄉㄨㄣ | tuən |
| duo | tuo / to | duo | ㄉㄨㄛ | tuo |
| —E— (6 syllables) 🏠 ⤒ [416] | ||||
| e | ê | e | ㄜ | ɤ |
| ê | eh | e | ㄝ | ɛ |
| ei | ei | ei | ㄟ | ei |
| en | en | en | ㄣ | ən |
| eng | eng | eng | ㄥ | ɤŋ |
| er | erh | er | ㄦ | ɚ |
| —F— (9 syllables) 🏠 ⤒ [416] | ||||
| fa | fa | fa | ㄈㄚ | fa |
| fan | fan | fan | ㄈㄢ | fan |
| fang | fang | fang | ㄈㄤ | fɑŋ |
| fei | fei | fei | ㄈㄟ | fei |
| fen | fen | fen | ㄈㄣ | fən |
| feng | feng | feng | ㄈㄥ | fɤŋ |
| fo | fo | fo | ㄈㄛ | fo |
| fou | fou | fou | ㄈㄡ | foʊ |
| fu | fu | fu | ㄈㄨ | fu |
| —G— (19 syllables) 🏠 ⤒ [416] | ||||
| ga | ka | ga | ㄍㄚ | ka |
| gai | kai | gai | ㄍㄞ | kaɪ |
| gan | kan | gan | ㄍㄢ | kan |
| gang | kang | gang | ㄍㄤ | kɑŋ |
| gao | kao | gao | ㄍㄠ | kaʊ |
| ge | ke / ko | ge | ㄍㄜ | kɤ |
| gei | kei | gei | ㄍㄟ | kei |
| gen | ken | gen | ㄍㄣ | kən |
| geng | keng | geng | ㄍㄥ | kɤŋ |
| gong | kung | gong | ㄍㄨㄥ | kuəŋ |
| gou | kou | gou | ㄍㄡ | koʊ |
| gu | ku | gu | ㄍㄨ | ku |
| gua | kua | gua | ㄍㄨㄚ | kuɑ |
| guai | kuai | guai | ㄍㄨㄞ | kuai |
| guan | kuan | guan | ㄍㄨㄢ | kuan |
| guang | kuang | guang | ㄍㄨㄤ | kuɑŋ |
| gui | kuei | guei | ㄍㄨㄟ | kuei |
| gun | kun | gun | ㄍㄨㄣ | kuən |
| guo | kuo | guo | ㄍㄨㄛ | kuo |
| —H— (21 syllables) 🏠 ⤒ [416] | ||||
| ha | ha | ha | ㄏㄚ | χa |
| hai | hai | hai | ㄏㄞ | χaɪ |
| han | han | han | ㄏㄢ | χan |
| hang | hang | hang | ㄏㄤ | χɑŋ |
| hao | hao | hao | ㄏㄠ | χaʊ |
| he | ho | he | ㄏㄜ | χɤ |
| hei | hei | hei | ㄏㄟ | χei |
| hen | hen | hen | ㄏㄣ | χən |
| heng | heng | heng | ㄏㄥ | χɤŋ |
| hm | hm | hm | ㄏㄇ | χm |
| hng | hng | hng | ㄏ兀 | χŋ |
| hong | hung | hong | ㄏㄨㄥ | χuəŋ |
| hou | hou | hou | ㄏㄡ | χoʊ |
| hu | hu | hu | ㄏㄨ | χu |
| hua | hua | hua | ㄏㄨㄚ | χuɑ |
| huai | huai | huai | ㄏㄨㄞ | χuai |
| huan | huan | huan | ㄏㄨㄢ | χuan |
| huang | huang | huang | ㄏㄨㄤ | χuɑŋ |
| hui | hui | huei | ㄏㄨㄟ | χuei |
| hun | hun | hun | ㄏㄨㄣ | χuən |
| huo | huo | huo | ㄏㄨㄛ | χuo |
| —J— (14 syllables) 🏠 ⤒ [416] | ||||
| ji | chi / tsi | ji | ㄐㄧ | ʨi |
| jia | chia | jia | ㄐㄧㄚ | ʨiɑ |
| jian | chien / tsien | jian | ㄐㄧㄢ | ʨiɛn |
| jiang | chiang / tsiang | jiang | ㄐㄧㄤ | ʨiɑŋ |
| jiao | chiao / tsiao | jiao | ㄐㄧㄠ | ʨiaʊ |
| jie | chieh / tsieh | jie | ㄐㄧㄝ | ʨiɛ |
| jin | chin / tsin | jin | ㄐㄧㄣ | ʨin |
| jing | ching / tsing | jing | ㄐㄧㄥ | ʨiŋ |
| jiong | chiung | jyong | ㄐㄩㄥ | ʨyuŋ |
| jiu | chiu / tsiu | jiou | ㄐㄧㄡ | ʨioʊ |
| ju | chü / tsü | jyu | ㄐㄩ | ʨy |
| juan | chüan | jyuan | ㄐㄩㄢ | ʨyuan |
| jue | chüeh / tsüeh | jyue | ㄐㄩㄝ | ʨyɛ |
| jun | chün / tsün | jyun | ㄐㄩㄣ | ʨyən |
| —K— (19 syllables) 🏠 ⤒ [416] | ||||
| ka | k'a | ka | ㄎㄚ | kʰa |
| kai | k'ai | kai | ㄎㄞ | kʰaɪ |
| kan | k'an | kan | ㄎㄢ | kʰan |
| kang | k'ang | kang | ㄎㄤ | kʰɑŋ |
| kao | k'ao | kao | ㄎㄠ | kʰaʊ |
| ke | k'e / k'o | ke | ㄎㄜ | kʰɤ |
| kei | k'ei | kei | ㄎㄟ | kʰei |
| ken | k'en | ken | ㄎㄣ | kʰən |
| keng | k'eng | keng | ㄎㄥ | kʰɤŋ |
| kong | k'ung | kong | ㄎㄨㄥ | kʰuəŋ |
| kou | k'ou | kou | ㄎㄡ | kʰoʊ |
| ku | k'u | ku | ㄎㄨ | kʰu |
| kua | k'ua | kua | ㄎㄨㄚ | kʰuɑ |
| kuai | k'uai | kuai | ㄎㄨㄞ | kʰuai |
| kuan | k'uan | kuan | ㄎㄨㄢ | kʰuan |
| kuang | k'uang | kuang | ㄎㄨㄤ | kʰuɑŋ |
| kui | k'uei | kuei | ㄎㄨㄟ | kʰuei |
| kun | k'un | kun | ㄎㄨㄣ | kʰuən |
| kuo | k'uo | kuo | ㄎㄨㄛ | kʰuo |
| —L— (26 syllables) 🏠 ⤒ [416] | ||||
| la | la | la | ㄌㄚ | la |
| lai | lai | lai | ㄌㄞ | laɪ |
| lan | lan | lan | ㄌㄢ | lan |
| lang | lang | lang | ㄌㄤ | lɑŋ |
| lao | lao | lao | ㄌㄠ | laʊ |
| le | le | le | ㄌㄜ | lɤ |
| lei | lei | lei | ㄌㄟ | lei |
| leng | leng | leng | ㄌㄥ | lɤŋ |
| li | li | li | ㄌㄧ | li |
| lia | lia | lia | ㄌㄧㄚ | liɑ |
| lian | lien | lian | ㄌㄧㄢ | liɛn |
| liang | liang | liang | ㄌㄧㄤ | liɑŋ |
| liao | liao | liao | ㄌㄧㄠ | liaʊ |
| lie | lieh | lie | ㄌㄧㄝ | liɛ |
| lin | lin | lin | ㄌㄧㄣ | lin |
| ling | ling | ling | ㄌㄧㄥ | liŋ |
| liu | liu | liou | ㄌㄧㄡ | lioʊ |
| lo | loh | lo | ㄌㄛ | lo |
| long | lung | long | ㄌㄨㄥ | luəŋ |
| lou | lou | lou | ㄌㄡ | loʊ |
| lu | lu | lu | ㄌㄨ | lu |
| lü | lü | lyu | ㄌㄩ | ly |
| luan | luan | luan | ㄌㄨㄢ | luan |
| lüe | lüeh | lyue | ㄌㄩㄝ | lyɛ |
| lun | lun | lun | ㄌㄨㄣ | luən |
| luo | lo | luo | ㄌㄨㄛ | luo |
| —M— (20 syllables) 🏠 ⤒ [416] | ||||
| m | m | m | ㄇ | m |
| ma | ma | ma | ㄇㄚ | ma |
| mai | mai | mai | ㄇㄞ | maɪ |
| man | man | man | ㄇㄢ | man |
| mang | mang | mang | ㄇㄤ | mɑŋ |
| mao | mao | mao | ㄇㄠ | maʊ |
| me | me | me | ㄇㄜ | mɤ |
| mei | mei | mei | ㄇㄟ | mei |
| men | men | men | ㄇㄣ | mən |
| meng | meng | meng | ㄇㄥ | mɤŋ |
| mi | mi | mi | ㄇㄧ | mi |
| mian | mien | mian | ㄇㄧㄢ | miɛn |
| miao | miao | miao | ㄇㄧㄠ | miaʊ |
| mie | mieh | mie | ㄇㄧㄝ | miɛ |
| min | min | min | ㄇㄧㄣ | min |
| ming | ming | ming | ㄇㄧㄥ | miŋ |
| miu | miou | miou | ㄇㄧㄡ | mioʊ |
| mo | mo | mo | ㄇㄛ | mo |
| mou | mou | mou | ㄇㄡ | moʊ |
| mu | mu | mu | ㄇㄨ | mu |
| —N— (26 syllables) 🏠 ⤒ [416] | ||||
| n | n | n | ㄋ | n |
| na | na | na | ㄋㄚ | na |
| nai | nai | nai | ㄋㄞ | naɪ |
| nan | nan | nan | ㄋㄢ | nan |
| nang | nang | nang | ㄋㄤ | nɑŋ |
| nao | nao | nao | ㄋㄠ | naʊ |
| ne | ne | ne | ㄋㄜ | nɤ |
| nei | nei | nei | ㄋㄟ | nei |
| nen | nen | nen | ㄋㄣ | nən |
| neng | neng | neng | ㄋㄥ | nɤŋ |
| ng | ng | ng | 兀 | ŋ |
| ni | ni | ni | ㄋㄧ | ni |
| nian | nien | nian | ㄋㄧㄢ | niɛn |
| niang | niang | niang | ㄋㄧㄤ | niɑŋ |
| niao | niao | niao | ㄋㄧㄠ | niaʊ |
| nie | nieh | nie | ㄋㄧㄝ | niɛ |
| nin | nin | nin | ㄋㄧㄣ | nin |
| ning | ning | ning | ㄋㄧㄥ | niŋ |
| niu | niu | niou | ㄋㄧㄡ | nioʊ |
| nong | nung | nong | ㄋㄨㄥ | nuəŋ |
| nou | nou | nou | ㄋㄡ | noʊ |
| nu | nu | nu | ㄋㄨ | nu |
| nü | nü | nyu | ㄋㄩ | ny |
| nuan | nuan | nuan | ㄋㄨㄢ | nuan |
| nüe | nüeh | nyue | ㄋㄩㄝ | nyɛ |
| nuo | no | nuo | ㄋㄨㄛ | nuo |
| —O— (2 syllables) 🏠 ⤒ [416] | ||||
| o | o | o | ㄛ | o |
| ou | ou | ou | ㄡ | oʊ |
| —P— (17 syllables) 🏠 ⤒ [416] | ||||
| pa | p'a | pa | ㄆㄚ | pʰa |
| pai | p'ai | pai | ㄆㄞ | pʰaɪ |
| pan | p'an | pan | ㄆㄢ | pʰan |
| pang | p'ang | pang | ㄆㄤ | pʰɑŋ |
| pao | p'ao | pao | ㄆㄠ | pʰaʊ |
| pei | p'ei | pei | ㄆㄟ | pʰei |
| pen | p'en | pen | ㄆㄣ | pʰən |
| peng | p'eng | peng | ㄆㄥ | pʰɤŋ |
| pi | p'i | pi | ㄆㄧ | pʰi |
| pian | p'ien | pian | ㄆㄧㄢ | pʰiɛn |
| piao | p'iao | piao | ㄆㄧㄠ | pʰiaʊ |
| pie | p'ieh | pie | ㄆㄧㄝ | pʰiɛ |
| pin | p'in | pin | ㄆㄧㄣ | pʰin |
| ping | p'ing | ping | ㄆㄧㄥ | pʰiŋ |
| po | p'o | po | ㄆㄛ | pʰo |
| pou | p'ou | pou | ㄆㄡ | pʰoʊ |
| pu | p'u | pu | ㄆㄨ | pʰu |
| —Q— (14 syllables) 🏠 ⤒ [416] | ||||
| qi | ch'i / ts'i | ci | ㄑㄧ | tɕʰi |
| qia | ch'ia | cia | ㄑㄧㄚ | tɕʰiɑ |
| qian | ch'ien / ts'ien | cian | ㄑㄧㄢ | tɕʰiɛn |
| qiang | ch'iang / ts'iang | ciang | ㄑㄧㄤ | tɕʰiɑŋ |
| qiao | ch'iao | ciao | ㄑㄧㄠ | tɕʰiaʊ |
| qie | ch'ieh / ts'ieh | cie | ㄑㄧㄝ | tɕʰiɛ |
| qin | ch'in / ts'in | cin | ㄑㄧㄣ | tɕʰin |
| qing | ch'ing / ts'ing | cing | ㄑㄧㄥ | tɕʰiŋ |
| qiong | ch'iung | cyong | ㄑㄩㄥ | tɕʰyuŋ |
| qiu | ch'iu / ts'iu | ciou | ㄑㄧㄡ | tɕʰioʊ |
| qu | ch'ü / ts'ü | cyu | ㄑㄩ | tɕʰy |
| quan | ch'üan / ts'üan | cyuan | ㄑㄩㄢ | tɕʰyuan |
| que | ch'üeh | cyue | ㄑㄩㄝ | tɕʰyɛ |
| qun | ch'ün | cyun | ㄑㄩㄣ | tɕʰyən |
| —R— (14 syllables) 🏠 ⤒ [416] | ||||
| ran | jan | ran | ㄖㄢ | ɹan |
| rang | jang | rang | ㄖㄤ | ɹɑŋ |
| rao | jao | rao | ㄖㄠ | ɹaʊ |
| re | je | re | ㄖㄜ | ɹɤ |
| ren | jen | ren | ㄖㄣ | ɹən |
| reng | jeng | reng | ㄖㄥ | ɹɤŋ |
| ri | jih | rih | ㄖ | ɹɭ |
| rong | jung | rong | ㄖㄨㄥ | ɹuəŋ |
| rou | jou | rou | ㄖㄡ | ɹoʊ |
| ru | ju | ru | ㄖㄨ | ɹu |
| ruan | juan | ruan | ㄖㄨㄢ | ɹuan |
| rui | jui | ruei | ㄖㄨㄟ | ɹuei |
| run | jun | run | ㄖㄨㄣ | ɹuən |
| ruo | jo | ruo | ㄖㄨㄛ | ɹuo |
| —S— (35 syllables) 🏠 ⤒ [416] | ||||
| sa | sa | sa | ㄙㄚ | sa |
| sai | sai | sai | ㄙㄞ | saɪ |
| san | san | san | ㄙㄢ | san |
| sang | sang | sang | ㄙㄤ | sɑŋ |
| sao | sao | sao | ㄙㄠ | saʊ |
| se | se | se | ㄙㄜ | sɤ |
| sen | sen | sen | ㄙㄣ | sən |
| seng | seng | seng | ㄙㄥ | sɤŋ |
| sha | sha | sha | ㄕㄚ | ʂa |
| shai | shai | shai | ㄕㄞ | ʂaɪ |
| shan | shan | shan | ㄕㄢ | ʂan |
| shang | shang | shang | ㄕㄤ | ʂɑŋ |
| shao | shao | shao | ㄕㄠ | ʂaʊ |
| she | she | she | ㄕㄜ | ʂɤ |
| shei | shei | shei | ㄕㄟ | ʂei |
| shen | shen | shen | ㄕㄣ | ʂən |
| sheng | sheng | sheng | ㄕㄥ | ʂɤŋ |
| shi | shih | shih | ㄕ | ʂɭ |
| shou | shou | shou | ㄕㄡ | ʂoʊ |
| shu | shu | shu | ㄕㄨ | ʂu |
| shua | shua | shua | ㄕㄨㄚ | ʂuɑ |
| shuai | shuai | shuai | ㄕㄨㄞ | ʂuai |
| shuan | shuan | shuan | ㄕㄨㄢ | ʂuan |
| shuang | shuang | shuang | ㄕㄨㄤ | ʂuɑŋ |
| shui | shui | shuei | ㄕㄨㄟ | ʂuei |
| shun | shun | shun | ㄕㄨㄣ | ʂuən |
| shuo | shuo | shuo | ㄕㄨㄛ | ʂuo |
| si | ssu / szu | sih | ㄙ | sɻ |
| song | sung | song | ㄙㄨㄥ | suəŋ |
| sou | sou | sou | ㄙㄡ | soʊ |
| su | su | su | ㄙㄨ | su |
| suan | suan | suan | ㄙㄨㄢ | suan |
| sui | sui | suei | ㄙㄨㄟ | suei |
| sun | sun | sun | ㄙㄨㄣ | suən |
| suo | so | suo | ㄙㄨㄛ | suo |
| —T— (19 syllables) 🏠 ⤒ [416] | ||||
| ta | t'a | ta | ㄊㄚ | tʰa |
| tai | t'ai | tai | ㄊㄞ | tʰaɪ |
| tan | t'an | tan | ㄊㄢ | tʰan |
| tang | t'ang | tang | ㄊㄤ | tʰɑŋ |
| tao | t'ao | tao | ㄊㄠ | tʰaʊ |
| te | t'e | te | ㄊㄜ | tʰɤ |
| teng | t'eng | teng | ㄊㄥ | tʰɤŋ |
| ti | t'i | ti | ㄊㄧ | tʰi |
| tian | t'ien | tian | ㄊㄧㄢ | tʰiɛn |
| tiao | t'iao | tiao | ㄊㄧㄠ | tʰiaʊ |
| tie | t'ieh | tie | ㄊㄧㄝ | tʰiɛ |
| ting | t'ing | ting | ㄊㄧㄥ | tʰiŋ |
| tong | t'ung | tong | ㄊㄨㄥ | tʰuəŋ |
| tou | t'ou | tou | ㄊㄡ | tʰoʊ |
| tu | t'u | tu | ㄊㄨ | tʰu |
| tuan | t'uan | tuan | ㄊㄨㄢ | tʰuan |
| tui | t'ui | tuei | ㄊㄨㄟ | tʰuei |
| tun | t'un | tun | ㄊㄨㄣ | tʰuən |
| tuo | t'uo / t'o | tuo | ㄊㄨㄛ | tʰuo |
| —W— (9 syllables) 🏠 ⤒ [416] | ||||
| wa | wa | wa | ㄨㄚ | uɑ |
| wai | wai | wai | ㄨㄞ | uai |
| wan | wan | wan | ㄨㄢ | uan |
| wang | wang | wang | ㄨㄤ | uɑŋ |
| wei | wei | wei | ㄨㄟ | uei |
| wen | wen | wen | ㄨㄣ | uən |
| weng | weng | wong | ㄨㄥ | uəŋ |
| wo | wo | wo | ㄨㄛ | uo |
| wu | wu | wu | ㄨ | u |
| —X— (14 syllables) 🏠 ⤒ [416] | ||||
| xi | hsi | si | ㄒㄧ | ɕi |
| xia | hsia | sia | ㄒㄧㄚ | ɕiɑ |
| xian | hsien | sian | ㄒㄧㄢ | ɕiɛn |
| xiang | hsiang | siang | ㄒㄧㄤ | ɕiɑŋ |
| xiao | hsiao | siao | ㄒㄧㄠ | ɕiaʊ |
| xie | hsieh | sie | ㄒㄧㄝ | ɕiɛ |
| xin | hsin | sin | ㄒㄧㄣ | ɕin |
| hsing | sing | ㄒㄧㄥ | ɕiŋ | |
| xiong | hsiung | syong | ㄒㄩㄥ | ɕyuŋ |
| xiu | hsiu | siou | ㄒㄧㄡ | ɕioʊ |
| xu | hsü | syu | ㄒㄩ | ɕy |
| xuan | hsüan | syuan | ㄒㄩㄢ | ɕyuan |
| xue | hsüeh | syue | ㄒㄩㄝ | ɕyɛ |
| xun | hsün | syun | ㄒㄩㄣ | ɕyən |
| —Y— (16 syllables) 🏠 ⤒ [416] | ||||
| ya | ya | ya | ㄧㄚ | iɑ |
| yai | yai | yai | ㄧㄞ | iaɪ |
| yan | yen | yan | ㄧㄢ | iɛn |
| yang | yang | yang | ㄧㄤ | iɑŋ |
| yao | yao | yao | ㄧㄠ | iaʊ |
| ye | yeh | ye | ㄧㄝ | iɛ |
| yi | i | yi | ㄧ | i |
| yin | yin | yin | ㄧㄣ | in |
| ying | ying | ying | ㄧㄥ | iŋ |
| yo | yo | yo | ㄧㄛ | io |
| yong | yung | yong | ㄩㄥ | yuŋ |
| you | yu | you | ㄧㄡ | ioʊ |
| yu | yü | yu | ㄩ | y |
| yuan | yuan | yuan | ㄩㄢ | yuan |
| yue | yüeh | yue | ㄩㄝ | yɛ |
| yun | yün | yun | ㄩㄣ | yən |
| —Z— (37 syllables) 🏠 ⤒ [416] | ||||
| za | tsa | za | ㄗㄚ | tsa |
| zai | tsai | zai | ㄗㄞ | tsaɪ |
| zan | tsan | zan | ㄗㄢ | tsan |
| zang | tsang | zang | ㄗㄤ | tsɑŋ |
| zao | tsao | zao | ㄗㄠ | tsaʊ |
| ze | tse | ze | ㄗㄜ | tsɤ |
| zei | tsei | zei | ㄗㄟ | tsei |
| zen | tsen | zen | ㄗㄣ | tsən |
| zeng | tseng | zeng | ㄗㄥ | tsɤŋ |
| zha | cha | jha | ㄓㄚ | tʂa |
| zhai | chai | jhai | ㄓㄞ | tʂaɪ |
| zhan | chan | jhan | ㄓㄢ | tʂan |
| zhang | chang | jhang | ㄓㄤ | tʂɑŋ |
| zhao | chao | jhao | ㄓㄠ | tʂaʊ |
| zhe | che | jhe | ㄓㄜ | tʂɤ |
| zhei | chei | jhei | ㄓㄟ | tʂei |
| zhen | chen | jhen | ㄓㄣ | tʂən |
| zheng | cheng | jheng | ㄓㄥ | tʂɤŋ |
| zhi | chih | jhih | ㄓ | tʂɭ |
| zhong | chung | jhong | ㄓㄨㄥ | tʂuəŋ |
| zhou | chou | jhou | ㄓㄡ | tʂoʊ |
| zhu | chu | jhu | ㄓㄨ | tʂu |
| zhua | chua | jhua | ㄓㄨㄚ | tʂuɑ |
| zhuai | chuai | jhuai | ㄓㄨㄞ | tʂuai |
| zhuan | chuan | jhuan | ㄓㄨㄢ | tʂuan |
| zhuang | chuang | jhuang | ㄓㄨㄤ | tʂuɑŋ |
| zhui | chui | jhuei | ㄓㄨㄟ | tʂuei |
| zhun | chun | jhun | ㄓㄨㄣ | tʂuən |
| zhuo | chuo / cho | jhuo | ㄓㄨㄛ | tʂuo |
| zi | tzu | zih | ㄗ | tsɻ |
| zong | tsung | zong | ㄗㄨㄥ | tsuəŋ |
| zou | tsou | zou | ㄗㄡ | tsoʊ |
| zu | tsu | zu | ㄗㄨ | tsu |
| zuan | tsuan | zuan | ㄗㄨㄢ | tsuan |
| zui | tsui | zuei | ㄗㄨㄟ | tsuei |
| zun | tsun | zun | ㄗㄨㄣ | tsuən |
| zuo | tso | zuo | ㄗㄨㄛ | tsuo |
Additional issues concerning Hanyu Pinyin are explained here. A separate PDF file (29 pages, A4) introducing Hanyu Pinyin with detailed explanations can be found here. Many special thanks to US linguist Tanya Visceglia PhD for explications about the pronunciation of modern Chinese and the IPA.
TOP HOME [◆ Sound of Mandarin Chinese]
===== ===== ===== ===== =====
◆ Selected traditional weights, measures, and numerals
++++++++++ TOP HOME [next chapter] [previous chapter] ++++++++++
While the use of the metric system is common in Taiwan, wet markets often still rely on traditional weights for their transactions. The most important units are shown below.
Weight
| Unit | Metric equivalent | Relation to other units |
|---|---|---|
| 1 qian 錢 ("mace") | 3.7799 g | 1/10 liang 兩 |
| 1 liang 兩 ("tael") | 37.799 g | 10 qian 錢 |
| 1 jin 斤 ("catty") | 604.789 g (1⅓ pounds avdp) | 16 liang 兩 |
| 1 dan 石 | 60.4789 kg | 1 dan 擔 ("picul") / 100 jin 斤 |
Apparently there is no uniform standard for Chinese weights in different Chinese societies. 1 tael gold ingots offered by precious metal salespersons in Taiwan have a weight of 37.5 grams, whereas 1 tael gold ingots sold in Hong Kong have a weight of 37.43 grams.
Linear measures
| Unit | Metric equivalent | Relation to other units |
|---|---|---|
| 1 li 厘 | 0.35814 mm | 1/100 cun 寸 |
| 1 cun 寸 | 3.5814 cm | 100 li 厘 |
| 1 chi 尺 | 35.814 cm | 10 cun 寸 |
| 1 bu 步 ("pace") | 179.07 cm | 5 chi 尺 |
| 1 zhang 丈 | 358.14 cm (141 inches) | 10 chi 尺 |
| 1 li 里 | 644.652 m | 360 bu 步 |
Area
| Unit | Metric equivalent | Relation to other units |
|---|---|---|
| 1 mu 畝 | 1/15 ha = 733 1/3 square yards = 613.16 m² | 240 square bu 步 |
| 1 qing 頃 | 6.6667 ha | 100 mu 畝 |
Notes: Another traditional area unit is the jia 甲 which equals 0.97 ha. In today's Taiwan an additional unit is still widely used as measurement for real estate like apartments—ping 坪, a Japanese unit introduced during the Japanese colonial period in Taiwan (1895-1945). One ping equals 6 x 6 Japanese chi [1 richi 日尺 = 30.3 cm], roughly 3.3 m²—or two standard rectangular tatami mats placed next to each other, forming a square.
Volume
| Unit | Metric equivalent | Relation to other units |
|---|---|---|
| 1 sheng 升 | 517.8312224 cm³ | 1/10 dou 斗 |
| 1 dou 斗 | 5178.312224 cm³ (316 cubic inches) | 10 sheng 升 |
| 1 yong 甬 | 51,783.12224 cm³ | 10 dou 斗 |
Chinese numerals
The Chinese use two sets of characters for numerals, one in the ordinary style as shown in the second line of the table below, and another one in a "large" style to avoid misspellings and fraud as shown in the fourth line. Please note that only traditional characters (fantizi 繁體字) are shown here, simplified characters (jiantizi 簡體字) are omitted.
| 0 | 1 | 2 | 3 | 4 | 5 | 6 | 7 | 8 | 9 | 10 | 100 | 1,000 | 10,000 | 100 million | 1 trillion |
| 0 | 一 | 二 | 三 | 四 | 五 | 六 | 七 | 八 | 九 | 十 | 百 | 千 | 萬 | 億 | 兆 |
| líng | yī | èr | sān | sì | wǔ | liù | qī | bā | jiǔ | shí | bǎi | qiān | wàn | yì | zhaò |
| 零 | 壹 | 貳 | 參 | 肆 | 伍 | 陸 | 柒 | 捌 | 玖 | 拾 | 佰 | 仟 | 萬 | 億 | 兆 |
Besides these basic Chinese numerals, there are also a few special characters: niàn 廿 (= 20), sà 卅 (= 30), xì 卌 (= 40), and bì 皕 (= 200).
The Chinese and the Western systems for numerals feature a fundamental difference which leads to frequent mistakes in conversion calculations for larger figures. The western system is based on the unit "1,000", meaning that from thousand to million, from million to billion, from billion to trillion and so on three digits are added. The Chinese system is based on the unit "10,000" (wan 萬), so from ten thousand to 100 million (yi 億), from 100 million to one trillion (zhao 兆) and so on four digits are added. The following table is meant to clarify the confusion.
| Figure | English (US) | Value | Chinese | Figure (Chinese partition) | |
|---|---|---|---|---|---|
| 1 | one | 100 | yī | 一 | 1 |
| 10 | ten | 101 | shí | 十 | 10 |
| 100 | one hundred | 102 | yī bǎi | 一百 | 100 |
| 1,000 | one thousand | 103 | yī qiān | 一千 | 1000 |
| 10,000 | ten thousand | 104 | yī wàn | 一萬 | 1,0000 |
| 100,000 | one hundred thousand | 105 | shí wàn | 十萬 | 10,0000 |
| 1,000,000 | one million | 106 | yī bǎi wàn | 一百萬 | 100,0000 |
| 10,000,000 | ten million | 107 | yī qiān wàn | 一千萬 | 1000,0000 |
| 100,000,000 | one hundred million | 108 | yī yì | 一億 | 1,0000,0000 |
| 1,000,000,000 | one billion | 109 | shí yì | 十億 | 10,0000,0000 |
| 10,000,000,000 | ten billion | 1010 | yī bǎi yì | 一百億 | 100,0000,0000 |
| 100,000,000,000 | one hundred billion | 1011 | yī qiān yì | 一千億 | 1000,0000,0000 |
| 1,000,000,000,000 | one trillion | 1012 | yī zhaò | 一兆 | 1,0000,0000,0000 |
| 10,000,000,000,000 | ten trillion | 1013 | shí zhaò | 十兆 | 10,0000,0000,0000 |
| 100,000,000,000,000 | one hundred trillion | 1014 | yī bǎi zhaò | 一百兆 | 100,0000,0000,0000 |
| 1,000,000,000,000,000 | one quadrillion | 1015 | yī qiān zhaò | 一千兆 | 1000,0000,0000,0000 |
The following table shows Chinese numerals equivalent to 1016 and higher.
| Value | Chinese | Meaning | Value | Chinese | Meaning | |||
|---|---|---|---|---|---|---|---|---|
| 1016 | yī jīng | 一京 | 10 quadrillion | 1036 | yī jiàn | 一澗 | 1 undecillion | |
| 1020 | yī gāi | 一垓 | 100 quintillion | 1040 | yī zhèng | 一正 | 10 duodecillion | |
| 1024 | yī zǐ | 一秭 | 1 septillion | 1044 | yī zài | 一載 | 100 tredecillion | |
| 1028 | yī ráng | 一穰 | 10 octillion | 1048 | yī jí | 一極 | 1 quindecillion | |
| 1032 | yī gōu | 一沟 | 100 nonillion | 1052 | yī hénghéshā | 一恆河沙 | 10 sexdecillion | |
A selection of prefixes for small Chinese numbers is listed below.
| Value | Prefix | Chinese | Value | Prefix | Chinese | Value | Prefix | Chinese | ||
|---|---|---|---|---|---|---|---|---|---|---|
| 10-1 | deci- | fèn 分 | 10-3 | milli- | háo 毫 | 10-5 | — | hū 忽 | ||
| 10-2 | centi- | lí 厘 / 釐 | 10-4 | — | sī 絲 | 10-6 | micro- | wēi 微 |
TOP HOME [◆ Weights, measures, numerals]
===== ===== ===== ===== =====
◆ Japan's Taiwan
++++++++++ TOP HOME [next chapter] [previous chapter] ++++++++++
Japan's colonial calendar
Japan has a calendar reminiscent of the Chinese system, based on the reign of their Emperor (tianhuang 天皇/Tennō), and it was used in Taiwan during the Japanese colonial period (1895-1945). At that time, a succession of three Emperors ruled the Land of the Rising Sun:
- Mutsuhito (Muren 睦仁 /~) in the Meiji Era (mingzhi 明治 /~),
- Yoshihito (Jiaren 嘉仁 /~) in the Taisho Era (dazheng 大正 /Taishō), and
- Hirohito (Yuren 裕仁 /~) in the Showa Era (zhaohe 昭和 /Shōwa).
Note: The tilde (~) is used to indicate that the common English depiction of the Japanese term is identical with the correct Romanization as used by linguists.
The table below shows biographical details of Japan's emperors since 1867.
| Name | Born | Ascension | Died | Era name |
|---|---|---|---|---|
| Mutsuhito 睦仁 | 1852, Nov. 3 | 1867, Feb. 3 | 1912, July 30 | Meiji 明治 |
| Yoshihito 嘉仁 | 1879, Aug. 31 | 1912, July 30 | 1926, Dec. 25 | Taisho 大正 |
| Hirohito 裕仁 | 1901, April 29 | 1926, Dec. 25 | 1989, Jan. 7 | Showa 昭和 |
| Akihito 明仁 | 1933, Dec. 23 | 1989, Jan. 7 | — | Heisei 平成 |
| Naruhito 德仁 | 1960, Feb. 23 | 2019, April 30 | — | Reiwa 令和 |
 After Hirohito died in 1989, he was followed on the throne by his son Akihito (Mingren 明仁 /~) who ushered the
Heisei Era (pingcheng 平成 /~). Akihito abdicated according to his wishes on April 30, 2019 and was succeeded by
his son Naruhito (Deren 德仁 /~), and on April 1, 2019 the Japanese cabinet announced that the incoming emperor's
era title (yuanhao 元號 /gengō) would be Reiwa (linghe 令和 /~), effective beginning May 1, 2019.
After Hirohito died in 1989, he was followed on the throne by his son Akihito (Mingren 明仁 /~) who ushered the
Heisei Era (pingcheng 平成 /~). Akihito abdicated according to his wishes on April 30, 2019 and was succeeded by
his son Naruhito (Deren 德仁 /~), and on April 1, 2019 the Japanese cabinet announced that the incoming emperor's
era title (yuanhao 元號 /gengō) would be Reiwa (linghe 令和 /~), effective beginning May 1, 2019.
The following table lists selected years of the emperors' eras according to the Japanese system for orientation.
| 1868 | Meiji Year 1 (明治元年) | 1945 | Showa Year 20 (昭和 20 年) | |
| 1895 | Meiji Year 28 (明治 28 年) | 1989 | Showa Year 64 (昭和 64 年) = Heisei Year 1 (平成元年) |
|
| 1912 | Meiji Year 45 (明治 45 年) = Taisho Year 1 (大正元年) |
|||
| 2019 | Heisei Year 31 (平成 31 年) = Reiwa Year 1 (令和元年) |
|||
| 1926 | Taisho Year 15 (大正 15 年) = Showa Year 1 (昭和元年) | |||
TOP HOME [◆ Japan's Taiwan] [Colonial calendar]
Brief outline of Japan's history
| Name of period / era | Years |
|---|---|
| Jōmon period 繩文 | ca. 14,000 — 1000 BC |
| Yayoi period 彌生 | 1000 BC — 300 A.D. |
| Kofun period 古墳 (aka Yamato period 大和) | 300–538 |
| Asuka period 飛鳥 | 538–710 |
| Nara period 奈良 | 710–794 |
| Heian period 平安 | 794–1185 |
| Kamakura period 鐮倉 | 1185–1333 |
| Muromachi period 室町 (aka Ashikaga period 足利) | 1336–1573 |
| Azuchi-Momoyama period 安土 桃山 | 1573–1603 |
| Edo period 江戶 (aka Tokugawa period 德川) | 1603–1868 |
| Meiji era 明治 | 1868–1912 (Emperor Mutsuhito 睦仁, 1852-1912) |
| Taishō era 大正 | 1912–1926 (Emperor Yoshihito 嘉仁, 1879-1926) |
| Shōwa era 昭和 | 1926–1989 (Emperor Hirohito 裕仁, 1901-1989) |
| Heisei era 平成 | 1989–2019 (Emperor Akihito 明仁, b. 1933; abdicated) |
| Reiwa era 令和 | since 2019 (Emperor Naruhito 德仁, b. 1960) |
TOP HOME [◆ Japan's Taiwan] [Colonial calendar]
Glossary of relevant Japanese terms
List of agencies, organizations and companies
Most (but not all) agencies, organizations and companies listed below were established by Japan during the period of Japanese colonial rule in Taiwan (1895-1945).
| Name (English) | Japanese kanji | Hiragana | Romanization |
|---|---|---|---|
| Aboriginal Affairs Headquarters | 蕃務本署 | ばんむほんしょ | Banmu Honsho |
| Advanced Academy of Agronomy and Forestry | 台湾総督府農林専門学校 | たいわんそうとくふのうりんせんもんがっこう | Taiwan Sōtokufu Nōrin Senmon Gakkō |
| Agricultural Experiment Station | 水稲試作所 | すいとうしさくじょ | Suitō Shisakujo |
| Agriculture Department, Taiwan Governor's Central Research Institute | 台湾総督府中央研究所農業部 | たいわんそうとくふちゅうおうけんきゅうじょのうぎょうぶ | Taiwan Sōtokufu Chūō Kenkyūjo Nōgyōbu |
| Agriculture Experiment Station | 農事試験場 | のうじしけんじょう | Nōji Shikenjō |
| Animal Antiserum Production Laboratory | 獣疫血清製造所 | じゅうえきけっせいせいぞうしょ | Jūeki Kessei Seizōsho |
| Association of East Asian Relations | 亜東関係協会 | あとうかんけいきょうかい | Atō Kankei Kyōkai |
| Bank of Taiwan (BOT) | 台湾銀行 | たいわんぎんこう | Taiwan Ginkō |
| Bureau of Foreign Affairs | 外事部 | がいじぶ | Gaiji Bu |
| Bureau of Judicial Affairs | 法務部 | ほうむぶ | Hōmu Bu |
| Changhua Youth Normal School | 台湾総督府彰化青年師範学校 | たいわんそうとくふしょうかせいねんしはんがっこう | Taiwan Sōtokufu Shōka Seinen Shihan Gakkō |
| Chia-I Bank | 嘉義銀行 | かぎぎんこう | Kagi Ginkō |
| Commercial and Industrial Bank of Taiwan | 台湾商工銀行 | たいわんこうしょうぎんこう | Taiwan Kōshō Ginkō |
| Consulate-General | 総領事館 | そうりょうじかん | Sōryōjikan |
| Dadao Municipal Government of Shanghai | 上海市大道政府 | シャンハイしだいどうせいふ | Shanhai Shi Daidō Seifu |
| Dai-Nippon Sugar Manufacturing Company | 大日本製糖株式会社 | だいにほんせいとうかぶしきがいしゃ | Dai Nihon Seitō Kabushiki Gaisha |
| Defense Agency | 防衛庁 | ぼうえいちょう | Bōei Chō |
| Department of Agriculture and Commerce | 農商局 | のうしょうきょく | Nōshō Kyoku |
| Department of Army | 陸軍局 | りくぐんきょく | Rikugun Kyoku |
| Department of Civil Affairs (1895) | 民政局 | みんせいきょく | Minsei Kyoku |
| Department of Civil Affairs (1898) | 民政部 | みんせいぶ | Minseibu |
| Department of Communications | 通信局 | つうしんきょく | Tsūshin Kyoku |
| Department of Education | 文教局 | ぶんきょうきょく | Bunkyō Kyoku |
| Department of Engineering | 土木局 | どぼくきょく | Doboku Kyoku |
| Department of Finance | 財務局 | ざいむきょく | Zaimu Kyoku |
| Department of General Affairs | 総務局 | そうむきょく | Sōmu Kyoku |
| Department of Internal Affairs | 内務局 | ないむきょく | Naimu Kyoku |
| Department of Military Affairs | 軍務局 | ぐんむきょく | Gunmu Kyoku |
| Department of Mines and Industry | 礦工局 | こうこうきょく | Kōkō Kyoku |
| Department of Navy | 海軍局 | かいぐんきょく | Kaigun Kyoku |
| Department of Police | 警務局 | けいむきょく | Keimu Kyoku |
| Department of Postal Affairs | 逓信局 | ていしんきょく | Teishin Kyoku |
| Department of Production | 殖産局 | しょくさんきょく | Shokusan Kyoku |
| Ensuiko Sugar Refining Co. Ltd. | 塩水港製糖株式会社 | えんすいこうせいとうかぶしきがいしゃ | Ensuik ō Seitō Kabushiki Gaisha |
| Field Command Postal Service | 野戦郵便局 | やせんゆうびんきょく | Yasen Yūbin Kyoku |
| Forestry Experimental Plot | 林業試験地 | りんぎょうしけんち | Ringyō Shikenchi |
| Great Japan Taiwan Hospital | 大日本台湾病院 | だいにっぽんたいわんびょういん | Dai Nippon Taiwan Byōin |
| Horse Breeding Farm | 種馬牧場 | たねうまぼくじょう | Taneuma Bokujō |
| Hsin-Kao Bank | 新高銀行 | にいたかぎんこう | Niitaka Ginkō |
| Imperial Japanese Army | 大日本帝国陸軍 | だいにっぽんていこくりくぐん | Dai-Nippon Teikoku Rikugun |
| Imperial Japanese Navy | 大日本帝国海軍 | だいにっぽんていこくかいぐん | Dai-Nippon Teikoku Kaigun |
| Interchange Association | 財団法人交流協会 | ざいだんほうじんこうりゅうきょうかい | Zaidan Hōjin Kōryu Kyōkai |
| Japan-ROC Diet Members' Consultative Council | 日華議員懇談会 | にっかぎいんこんだんかい | Nikka Giin Kondankai |
| Japan–Taiwan Exchange Association | 公益財団法人日本台湾交流協会 | こうえきざいだんほうじんにほんたいわんこうりゅうきょうかい | Kōeki Zaidan Hōjin Nihon Taiwan Kōryū Kyōkai |
| Japanese Cultural Center | 日本文化中心 | にほんぶんかちゅうしん | Nihon Bunka Chūshin |
| Japanese Overseas Agency in Taipei | 日本駐台北海外事務所 | にほんちゅう タイペイ かいがいじむしょ | Nihon Chū Taipei Kaigai Jimusho |
| Kaohsiung Office | 高雄事務所 | たかお じむしょ | Takao Jimusho |
| Kwantung Army | 関東軍 | かんとうぐん | Kantō Gun |
| League for the Establishment of a Formosan Parliament | 台湾議会期成同盟会 | たいわんぎかいきせいどうめいかい | Taiwan Gikai Kisei Dōmeikai |
| Manchukuo | 満洲国 | まんしゅうこく | Manshū Koku |
| Meiji Sugar Company | 明治製糖株式会社 | めいじせいとうかぶしきがいしゃ | Meiji Seitō Kabushiki Gaisha |
| Ministry of Defense | 防衛省 | ぼうえいしょう | Bōei Shō |
| Ministry of Taiwan Railway | 台湾総督府鉄道部 | たいわんそうとくふてつどうぶ | Taiwan Sōtokufu Tetsudōbu |
| Mitsubishi Heavy Industries Corporation | 三菱重工業株式会社 | みつびしじゅうこうぎょうかぶしきがいしゃ | Mitsubishi Jūkōgyō Kabushiki Gaisha |
| Monopoly Bureau of the Taiwan Governor's Office | 台湾総督府専売局 | たいわんそうとくふせんばいきょく | Taiwan Sōtokufu Senbaikyoku |
| National Defense Academy of Japan | 防衛大学校 | ぼうえいだいがっこう | Bōei Daigakkō |
| New People Society | 新民会 | しんみんかい | Shin Minkai |
| North Thermal Power Plant | 北部火力発電所 | ほくぶかりょくはつでんしょ | Hokubu Hatsudensho |
| Peking government | 北京政府 | ぺきんせいふ | Pekin Seifu |
| Police Headquarters | 警察本署 | けいさつほんしょ | Keisatsu Honsho |
| Provisional Government of the Republic of China | 中華民国臨時政府 | ちゅうかみんこくりんじせいふ | Chūka Minkoku Rinji Seifu |
| Railway Ministry | 台湾総督府交通局鉄道部 | たいわんそうとくふこうつうきょくてつどうぶ | Taiwan Sōtokufu Kōtsū Kyoku Tetsudōbu |
| Reformed Government of the Republic of China | 中華民国維新政府 | ちゅうかみんこくいしんせいふ | Chūka Minkoku Ishin Seifu |
| Republic of Formosa | 台湾民主国 | たいわんみんしゅこく | Taiwan Minshu Koku |
| Rinderpest Antiserum Production Laboratory | 牛疫血清作業所 | ぎゅうえきけっせいさぎょうしょ | Gyūeki Kessei Sagyōsho |
| Ryukyu Domain | 琉球藩 | りゅうきゅうはん | Ryūkyū Han |
| Ryukyu Kingdom | 琉球国 | りゅうきゅうこく | Ryūkyū Koku |
| Savings Bank of Taiwan | 台湾貯蓄銀行 | たいわん ちょちく ぎんこう | Taiwan Chochiku Ginkō |
| Secretariat to the Governor-General | 総督官房 | そうとくか ん ぼう | Sōtoku Kanbō |
| Songshan Air Base | 松山飛行基地 | まつやまひこうきち | Matsuyama Hikō Kichi |
| Songshan Airport | 松山飛行場 | まつやま ひこうじょう | Matsuyama Hikōjō |
| Sugarcane Seedling Nursery | 蔗苗養成所 | しゃ びょう ようせいじょ | ShabyōYōseijo |
| Taichu Advanced College of Agronomy and Forestry | 台中高等農林学校 | たいちゅうこうとうのうりんがっこう | Taichū Kōtō Nōrin Gakkō |
| Taichu Prefectural Library | 台中州立図書館 | たいちゅうしゅうりつとしょかん | Taichū Shūritsu Toshokan |
| Taihoku Botanical Garden | 台北植物園 | たいほく しょくぶつえん | Taihoku Shokubutsuen |
| Taihoku College | 台湾総督府台北高等学校 | たいわんそうとくふたいほくこうとうがっこう | Taiwan Sōtokufu Taihoku Kōtōgakkō |
| Taihoku Imperial University | 台北帝国大学 | たいほくていこくだいがく | Taihoku Teikoku Daigaku |
| Taihoku Observatory | 台北観測所 | たいほくかんそくしょ | Taihoku Kansokujo |
| Taihoku Regional Court | 台北地方法院 | たいほくちほうほういん | Taihoku Chihō Hōin |
| Taihoku Seedling Nursery | 台北苗圃 | たいほく びょうほ | Taihoku Byōho |
| Taihoku Weather Monitoring Station under the Taiwan Governor's Office | 台湾総督府台北測候所 | たいわんそうとくふたいほくそっこうじょ | Taiwan Sōtokufu Taihoku Sokkōjo |
| Tainan Technical College (1931) | 台南高等工業学校 | たいなんこうとうこうぎょうがっこう | Tainan Kōtō Kōgyō Gakkō |
| Tainan Technical College (1944) | 台南工業專門学校 | たいなんこうぎょうせんもんがっこう | Tainan Kōgyō Senmon Gakkō |
| Taipei Culture Center | 台北文化中心 | たいほくぶんかちゅうしん | Taihoku Bunka Chūshin |
| Taipei Economic and Cultural Representative Office | 台北経済文化代表処 | タイペイけいざいぶんかだいひょうしょ | Taipei Keizai Bunka Daihyōsho |
| Taipei Economic and Cultural Representative Office in Japan | 台北駐日経済文化代表処 | タイペイちゅうにちけいざいぶんかだいひょうしょ | Taipei Chūnichi Keizai Bunka Daihyōsho |
| Taipei Economic and Cultural Representative Office in Japan | 台北駐日経済文化代表処 | たいぺいちゅうにちけいざいぶんかだいひょうしょ | Taipei Chūnichi Keizai Bunka Daihyōsho |
| Taiwan Assimilation Society | 台湾同化会 | たいわんどうかかい | Taiwan Dōkakai |
| Taiwan Camphor Bureau | 台湾樟脳局 | たいわんしょうのうきょく | Taiwan Shōnō Kyoku |
| Taiwan Dockyard Corporation | 台湾船渠株式会社 | たいわんせんきょかぶしきがいしゃ | Taiwan Senkyo Kabushiki Gaisha |
| Taiwan Governor's Agriculture Laboratory | 台湾総督府農業試験所 | たいわんそうとくふのうぎょうしけんじょ | Taiwan Sōtokufu Nōgyō Shikenjo |
| Taiwan Governor's Bureau of Productive Industries | 台湾総督府殖産局 | たいわんそうとくふしょくさんきょく | Taiwan Sōtokufu Shōkusan Kyoku |
| Taiwan Governor's High Court | 台湾総督府高等法院 | たいわんそうとくふこうとうほういん | Taiwan Sōtokufu Kōtō Hōin |
| Taiwan Governor's High Court Prosecution Bureau | 台湾総督府高等法院検察局 | たいわんそうとくふこうとうほういんけんさつきょく | Taiwan Sōtokufu Kōtō Hōin Kensatsu Kyoku |
| Taiwan Governor's Library | 台湾総督府図書館 | たいわんそうとくふとしょうかん | Taiwan Sōtokufu Toshōkan |
| Taiwan Governor Museum | 台湾総督府民政部殖産局附属博物館 | たいわんそうとくふみんせいぶしょくさんきょくふぞくはくぶつかん | Taiwan Sōtokufu Minseibu Shokusan Kyoku Fuzoku Hakubutsukan |
| Taiwan Governor's Office Weather Observatory | 台湾総督府気象台 | たいわんそうとくふきしょうだい | Taiwan Sōtokufu Kishōdai |
| Taiwan Independence Revolutionary Council | 台湾独立革命委員会 | たいわんどくりつかくめいいいんかい | Taiwan Dokuritsu Kakumei Iinkai |
| Taiwan Medical School | 台湾総督府医学校 | たいわんそうとくふいがっこう | Taiwan Sōtokufu Igakkō |
| Taiwan People's Party | 台湾民党 | たいわんみんとう | Taiwan Mintō |
| Taiwan Pharmaceutical Factory | 台湾製薬所 | たいわんせいやくしょ | Taiwan Seiyakusho |
| Taiwan Power Corporation | 台湾電力株式会社 | たいわんでんりょくかぶしきがいしゃ | Taiwan Denryoku Kabushiki Gaisha |
| Taiwan Provincial College | 台湾総督府高等学校 | たいわんそうとくふこうとうがっこう | Taiwan Sōtokufu Kōtōgakkō |
| Taiwan Salt Bureau | 台湾塩務局 | たいわんえんむきょく | Taiwan Enmu Kyoku |
| Taiwan Shinkansen | 台湾新幹線 | たいわんしんかんせん | Taiwan Shinkansen |
| Taiwan Steel Works | 株式会社台湾鉄工所 | かぶしきがいしゃたいわんてっこうしょ | Kabushiki Gaisha Taiwan Tekkōjo |
| Taiwan Sugar Company | 台湾製糖株式会社 | たいわんせいとうかぶしきがいしゃ | Taiwan Seitō Kabushiki Gaisha |
| Taiwanese Alliance for Home Rule | 台湾地方自治聯盟 | たいわんちほうじちれんめい | Taiwan Chihō Jichi Renmei |
| Taiwanese Communist Party | 台湾共産党 | たいわんき ょうさんとう | Taiwan Kyōsantō |
| Taiwanese Cultural Association | 台湾文化協会 | たいわんぶんかきょうかい | Taiwan Bunka Kyōkai |
| Taiwanese Popular Party | 台湾民衆党 | たいわんみんしゅうとう | Taiwan Minshūtō |
| Takasago Malted Beer Company | 高砂麦酒株式会社 | たかさごびーるかぶしきがいしゃ | Takasago Bīru Kabushiki Gaisha |
| Takasago Volunteers | 高砂義勇隊 | たかさごぎゆうたい | Takasago Giyūtai |
| Tatung Iron Works | 株式会社大同鉄工所 | かぶしきがいしゃだいどうてっこうじょ | Kabushiki Gaisha Daitō Tekkōjo |
| Tea Manufacture Experiment Station | 台湾総督府殖産局附属製茶試験場 | たいわんそうとくふしょくさんきょくふぞくせいちゃしけんじょう | Taiwan Sōtokufu Shōkusan Kyoku Fuzoku Seicha Shikenjō |
| Toko Kogyo Corporation | 東光興業株式会社 | とうこうこうぎょうかぶしきがいしゃ | Tōkō Kōgyō Kabushiki Gaisha |
| Tokyo Office, Association of East Asian Relations | 亜東関係協会東京弁事処 | あとうかんけいきょうかいとうきょうべんじしょ | Atō Kankei Kyōkai Tōkyō Benjisho |
| Tribute to the Emperor Society | 皇民奉公会 | こうみんほうこうかい | Kōmin Hōkōkai |
| Unit 731 | 731 部隊 | ななさんいちぶたい | Nana San Ichi Butai |
| Wushantou Reservoir | 烏山頭貯水池 | うさんとうちょすいち | Usantō Chosuichi |
| Yasukuni Shrine | 靖国神社 | やすくにじんじゃ | Yasukuni Jinja |
| Zuoying Harbour | 左営港 | さえいこう | Saei Kō |
TOP HOME [◆ Japan's Taiwan] [Glossary]
List of treaties, documents and other important terms
Please note that in the table below the pronunciation for some geographical names of places outside Japan (e. g. Potsdam, Versailles) is shown not in Hiragana but in Katakana.
| Name (English) | Japanese kanji | Hiragana | Romanization |
|---|---|---|---|
| Chang Tso-lin Incident | 張作霖爆殺事件 | ちょうさくりんばくさつじけん | Chō Sakurin Baku Satsu Jiken |
| First Instrument of Surrender | 日本の降伏文書 | にほんのこうふくぶんしょ | Nihonno Kōfuku Bunsho |
| Greater East Asia Co-Prosperity Sphere | 大東亜共栄圏 | だいとうあきょうえいけん | Dai Tōa Kyōeiken |
| Jinan Incident | 済南事件 | さいなんじけん | Sainan Jiken |
| Liaotung Convention | 遼東還付条約 | りょうとうかんぷじょうやく | Ryōtō Kanpu Jōyaku |
| Manchuria Incident | 満洲事変 | まんしゅうじへん | Manshū Jihen |
| Okinawa Reversion Agreement | 沖縄返還協定 | おきなわへんかんきょうてい | Okinawa Henkan Kyōtei |
| Operation Ichi-Go | 大陸打通作戦 | たいりくだつうさくせん | Tairiku Datsū Sakusen |
| Peace Treaty between the ROC and Japan | 日本国と中華民国との間の平和条約 | にほんこくとちゅうかみんこくとのあいだのへいわじょうやく | Nihon Kokuto Chuka Minkoku Tono Aidano Heiwa Jōyaku |
| Potsdam Agreement | ポツダム協定 | ポツダムきょうてい | Potsudamu Kyōtei |
| Potsdam Declaration | ポツダム宣言 | ポツダムせんげん | Potsudamu Sengen |
| Republic of Formosa—Declaration of Independence | 台湾民主国独立宣言 | たいわんみんしゅこくどくりつせんげん | Taiwan Minshu Koku Dokuritsu Sengen |
| San Francisco Peace Treaty | 日本国との平和条約 | にっぽんこくとのへいわじょうやく | Nippon Kokutono Heiwa Jōyaku |
| Sino-Japanese War | 日清戦争 | にっしんせんそう | Nisshin Sensō |
| Soviet-Japanese Neutrality Pact | 日ソ中立条約 | にっ ソちゅうりつじょうやく | Nisso Chūritsu Jōyaku |
| Taiwan-Japan Fisheries Agreement | 日台漁業取り決め | にったいぎょぎょうとりきめ | Nittai Gyogyō Tori Kime |
| Tanggu Truce | 塘沽協定 | タンクきょうてい | Tanku Kyōtei |
| Treaty of Peace and Friendship | 日本国と中華人民共和国との間の平和友好条約 | にほんこくとちゅうかじんみんきょうわこくとのあいだのへいわゆうこうじょうやく | Nihon Kokuto Chūgoku Jimmin Kyōwakoku Tono Aidano Heiwa Yūkō Jōyaku |
| Treaty of Shimonoseki | 下関条約 | しものせきじょうやく | Shimonoseki Jōyaku |
| Treaty of Versailles | ヴェルサイユ条約 | ヴェルサイユじょうやく | Verusaiyu Jōyaku |
| Triple Intervention | 三国干渉 | さんごくかんしょう | San Goku Kanshō |
| Twenty-One Demands | 対華二十一ヵ条要求 | たいか 21 かじょうようきゅう | Taika Nijūikkajō Yōkyū |
The Japanese writing system has its roots in Chinese characters. More details about this topic can be found in a separate PDF file (18 pages in A4 format), click here.
Another PDF file (73 pages in A4 format) provides information about the 3,000 most frequently used Chinese characters and more—click here.
Additional information pertaining to that subject can be found on the following pages of this website.
| 🔴 | "Introduction Taiwan / ROC", Facts about Japan's colonial rule over Taiwan |
| 🔴 | "Foreign relations of the ROC", The ROC and Japan |
TOP HOME [◆ Japan's Taiwan] [Glossary]
===== ===== ===== ===== =====
◆ The dynasties of imperial China: An overview
++++++++++ TOP HOME [previous chapter] ++++++++++
| Dynasty / period | Dates | |
|---|---|---|
| Xia 夏 (legendary) | (trad. 2205-1766 BC) ca. 2000-1500 BC |
|
| Shang 商 aka Yin 殷 | (trad. 1766-1122 BC) ca. 1500-1000 BC |
|
| Zhou 周 | ca. 1000-221 BC | |
| —Western Zhou 西周 | (trad. 1122-770 BC) ca. 1000-770 BC |
|
| —Eastern Zhou 東周 | 770-221 BC | |
| ——Spring and Autumn Period 春秋 | trad. 770-476 BC | |
| ——Warring States Period 戰國時代 | trad. 475-221 BC | |
| Qin 秦 | 221-207 BC | |
| Han 漢 | 207 BC – 220 AD | |
| —Western Han 西漢 | 207 BC – 8 AD | |
| —Xin 新 (Interregnum of Wang Mang 王莽) | 9-23 AD | |
| —Eastern Han 東漢 | 23-220 AD | |
| Three Kingdoms 三國時代 | 220-280 | |
| —Wei 魏 (Cao Wei 曹魏) | 220-265 | |
| —Shu 蜀 (Minor Han/Shu Han 蜀漢) | 221-263 | |
| —Wu 吳 | 222-280 | |
| Western Jin 西晉 | 265/280-316 | |
| • PERIOD OF DIVISION (incl. Southern and Northern Dynasties 南北朝) • | ||
| North China | The Sixteen Nations 五胡十六國 | 304-439 |
| Northern Dynasties 北朝 | 386-589 | |
| South China | Eastern Jin 東晉 | 317-419 |
| Southern Dynasties 南朝 | 386-589 | |
| Sui 隋 | 581/589-618 | |
| Tang 唐 | 618-907 | |
| • PERIOD OF DIVISION: The Five Dynasties and Ten Kingdoms 五代十國 • | ||
| —Five Dynasties 五代 | 907-960 | |
| —Ten Kingdoms 十國 | 902-979 | |
| Song 宋 | 960/979-1279 | |
| —Northern Song 北宋 | 960/979-1126 | |
| —Southern Song 南宋 | 1126-1279 | |
| Yuan 元 [Mongols] | 1279-1368 | |
| Ming 明 | 1368-1644 | |
| Qing 清 [Manchus] | 1644-1911 | |
For a more detailed account of Imperial China's history click here. The Xinhai Revolution (xinhai geming 辛亥革命) which brought Imperial China to an end is described here.
The history of the ROC is introduced here, and aspects of Taiwan's history (much more than just the ROC!) are presented here.
TOP HOME [◆ Dynasties of imperial China]
===== ===== ===== ===== =====
↻ This page was last updated/edited on July 13, 2026.
 |
 |